The German Recession Is About To Turn Around - No Need To Run For Gold
Rumors and fears of recession in Germany are in the news.
The facts show the slow down in exports in not from the U.S. despite the trade war rhetoric.
Weakness in the UK and other European trade partners is more to blame for the decline in exports.
Facts show that export weakness is bottoming helped in part by a weaker euro and a return to world central bank easing policies.
The purpose of this article is to review German sectoral flow balances and credit growth to ascertain the likelihood of the much talked about German economic slowdown and recession. To understand the fiscal flows, one has to look at the balance of sectoral flows within the German economy using stock flow-consistent sectoral flow analysis.
Professor Wynne Godley first comprehended the strategic importance of the accounting identity, which says that measured at current prices, the government's budget balance, less the current account balance, by definition is equal to the private sector balance.
GDP = Federal Spending [G] + Non-Federal spending [P] + Net Exports [X].
As a percentage of GDP, all three sectors sum to zero and balance each other out.
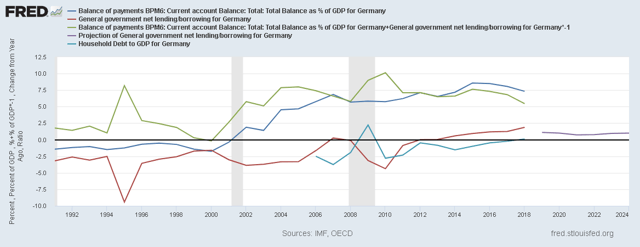
The chart below shows the sectoral flows for Germany.
The above chart, in addition to the traditional Government sector [red] and external sector [blue] and private sector [green], includes a light blue line for the credit growth rate.
What the chart is showing is as follows:
1. The Federal government sector is moving into a surplus. What this means in terms of this chart is that the red line is moving above zero on the X-axis. The purple line extending out into the future is the forecast of the future budget balance. The overall contribution of the Federal government sector to the economy is small, whether positive or negative. Germany's fortunes are reliant on its international trading result, which has a much larger share of the sectoral balances.
2. The above-mentioned government surplus has to come from somewhere. The chart shows that the green line (which is the private domestic sector) is moving downwards. When one views the chart in its entirety, one sees that the red and green lines are practically a mirror image. The Federal surplus is coming out of the private domestic sector, and it is falling as a percentage of GDP in the same way the Federal government surplus is rising.
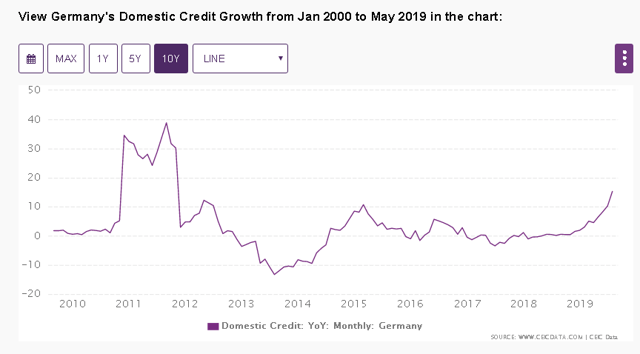
The light blue line is the change in credit growth for the private domestic sector. It, too, is moving into positive territory. This can be for many reasons and is often because businesses and households borrow more to maintain spending levels in the face of falling incomes. From a balance of account point of view, it is clear that the private domestic sector is in decline and taking on more debt to maintain spending in excess of income3. The magnitude of the debt as a percentage of GDP is moving in parallel with the Federal government's share of the sectoral balance and means in essence that the businesses and households in the private domestic sector are paying for the Federal government surplus with debt.
The growth in debt can be seen in the chart below.
 3. The dark blue line is the current account balance. This line is exports less imports and includes net international financial transactions. Since 2000 Germany has been proud to have an export surplus, and this shows up in the national accounts and the sectoral balances as a positive flow of funds. One sees that the line is now descending. This may or may not be due to the USA trade war.
The chart below from Mr. Robert P. Balan and his Predictive Analytic Models service shows that Germany's exports to the USA dwarf those to its other trading partners. A problem trading with the USA will, therefore, have a significant impact on German export results.
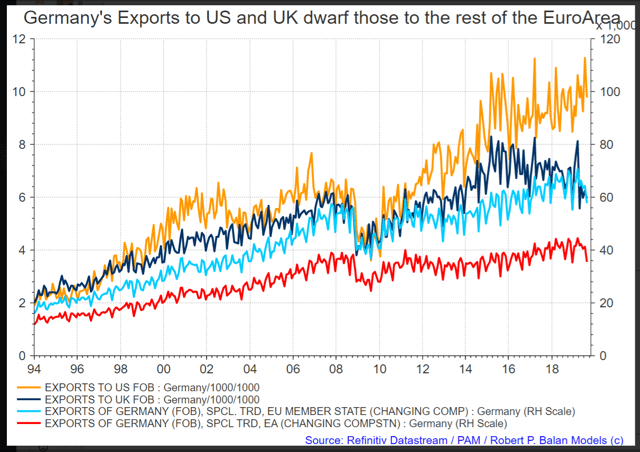 The chart shows exports to the USA are mostly unaffected but that a drop in exports to the UK and other Euro member states is more likely the cause.
Aggregate demand weakness in the UK and the Euro area can be traced back to low growth rates and public policy drive by austerity politics.
More likely, it is more to do with a general global slow down that may be coming to an end.
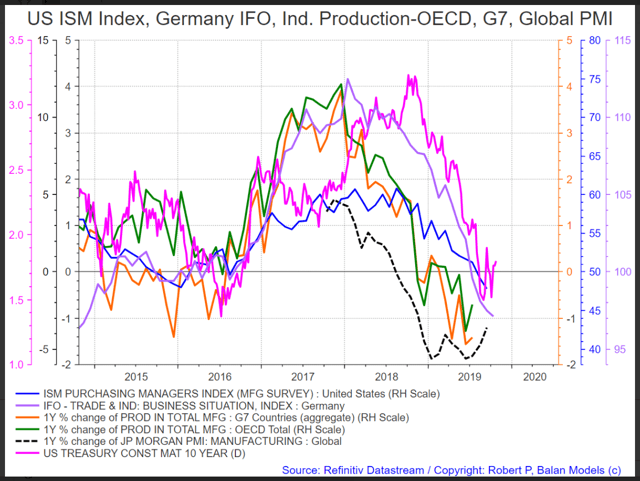 The above change rate analysis shows that the indicators are bottoming and turning back upwards in a similar pattern to what happened in 2016. 2016 was the end of the last global slow down. The global slowdowns are tied to decisions by central banks to stop and start interest rate rises and quantitative easing cycles. The new easing cycle has begun, and so growth turns positive again as this defacto fiscal spending grows the economy.
Germany's GDP and overall wealth are strongly influenced by how weak, or strong the Euro is. The chart below shows that a strong Euro negatively impacts GDP nine months later. (note the left Y-axis is reversed)
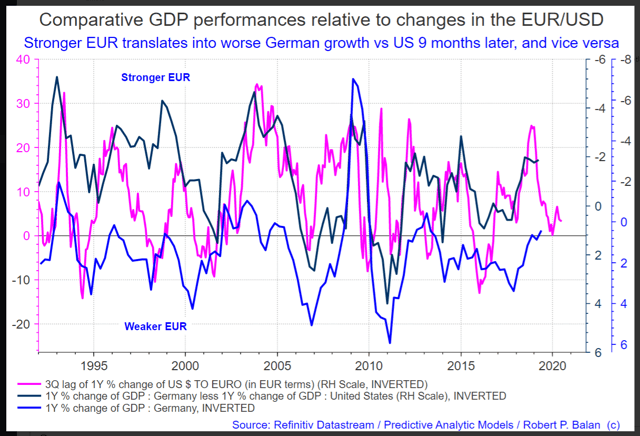 The Euro is bottoming at present, and so German GDP can be expected to improve over the next year. Germany's success as a net surplus trading nation began in 2000 with the adoption of the Euro. The Euro is weaker than a German sovereign currency would be and thus allows more to be exported at a lower price than competitors. The value of the Euro is "pulled down" by the weaker net import lands that make up the rest of the Euro area.
The overall conclusion is that while many proclaim a slow down and recession in Germany a turnaround is just around the corner and will be brought about by both a weak Euro and a return to more accommodative defacto fiscal policy from world central banks.
An investor wishing to trade stock market movements in Germany could do so using the following German ETF funds that mirror the broad stock market index:
(EWG) | iShares MSCI Germany ETF |
(HEWG) | iShares Currency Hedged MSCI Germany ETF |
(FGM) | First Trust Germany AlphaDEX Fund |
(DXGE) | WisdomTree Germany Hedged Equity Fund |
(EWGS) | iShares MSCI Germany Small-Cap ETF |
(DBGR) | Xtrackers MSCI Germany Hedged Equity Fund |
(DAX) | Global X DAX Germany ETF |
(FLGR) | Franklin FTSE Germany ETF |
(GRMY) | Xtrackers Germany Equity ETF |
Disclosure: I/we have no positions in any stocks mentioned, and no plans to initiate any positions within the next 72 hours. I wrote this article myself, and it expresses my own opinions. I am not receiving compensation for it (other than from Seeking Alpha). I have no business relationship with any company whose stock is mentioned in this article.
Follow Alan Longbon and get email alerts