The Gold And Long-Dollar ETFs In Trading Ranges, While Commodities Poised To Pop
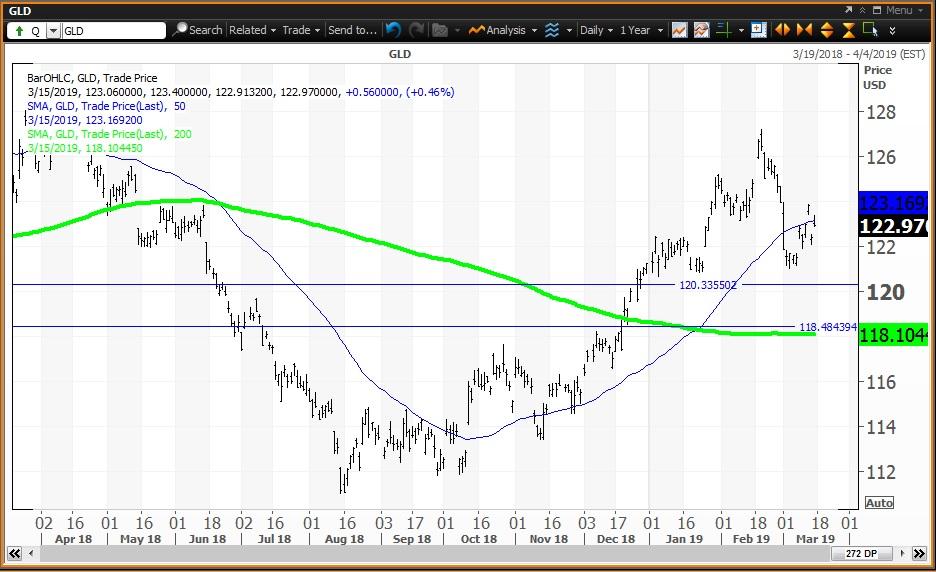
The gold shares ETF is trading between my semiannual value level at $120.36 and the Feb. 20 high at $127.21.
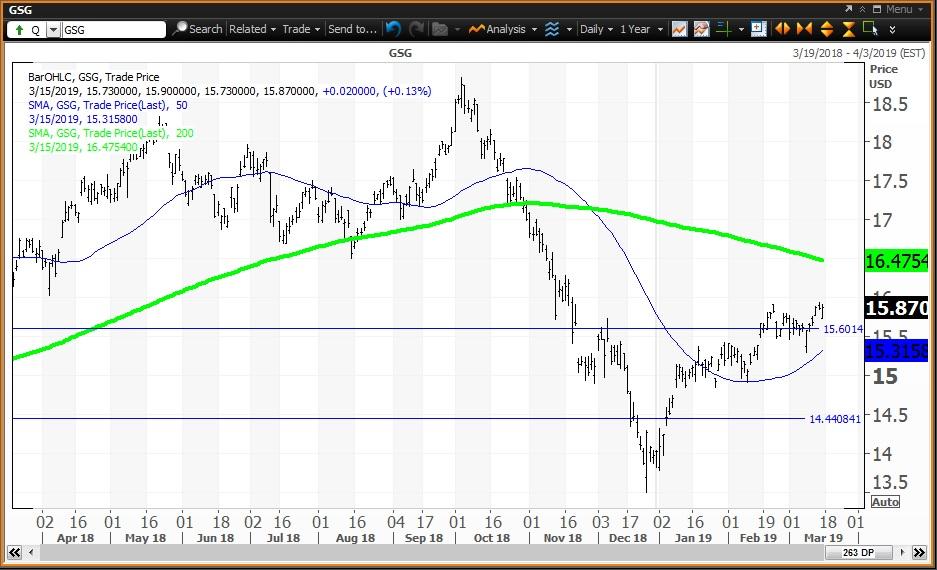
The commodities ETF is poised to pop if it holds its 200-week SMA at $15.78 upside to its 200-day SMA at $16.48.
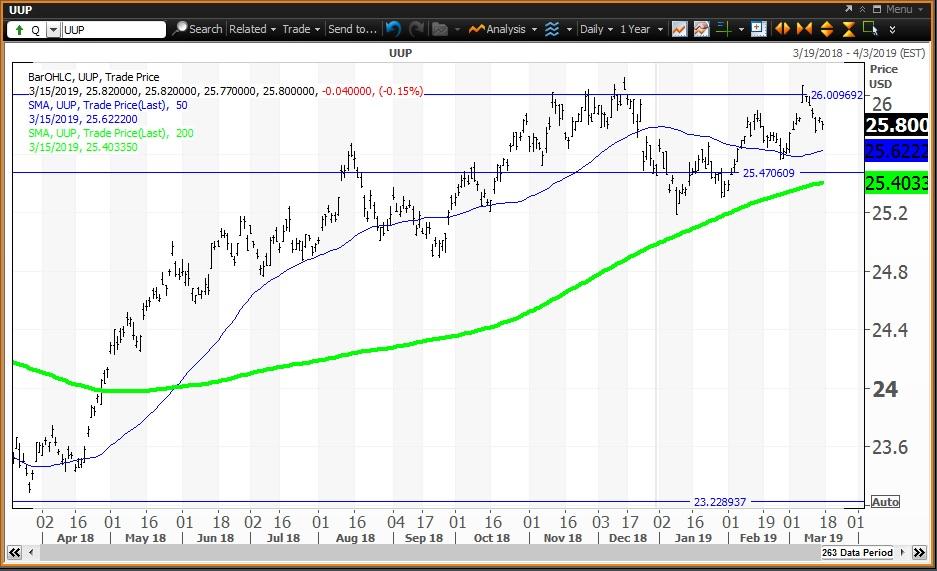
The long dollar ETF is trading between my annual pivot at $25.47 and my semiannual risky level at $26.39.
Here are the daily charts for the gold, commodities and the dollar ETFs.
The gold trust ETF tracks the spot price of gold and is said to be backed by gold bars in vaults in London.
SPDR Gold Trust ETF (NYSEARCA:GLD)
 Courtesy of MetaStock Xenith
The gold ETF ($122.97 on March 15) is up 1.4% so far in 2019 and is 10.7% above its Aug. 15 low of $111.06. GLD has a neutral weekly chart with the ETF above its five-week modified moving average at $122.78 and above its 200-week simple moving average or "reversion to the mean" at $118.08. The 12x3x3 weekly slow stochastic reading ended last week slipping to 69.26, down from 78.88 on March 8, falling below the overbought threshold of 80.00 and no longer above 90.00 which is my reading for an "inflating parabolic bubble".
Investor Strategy: Buy weakness to my semiannual and monthly value levels at $120.36 and $118.45, respectively, and reduce holdings on strength to my quarterly risky level at $130.76. My annual value level lags at $110.38.
The commodity ETF is heavily-weighted to energy by about 60%.
iShares S&P GSCI Commodity-Indexed Trust ETF (NYSEARCA:GSG)
 Courtesy of MetaStock Xenith
The commodities ETF ($15.87 on March 15) is up 13.2% so far in 2019 and up 17.6% since its Dec. 26 low of $13.50. This ETF is down 15.6% from its Oct. 3 high of $18.81. GSG has a positive weekly chart with the ETF above its five-week MMA of $15.53 and just above its 200-week SMA or "reversion to the mean" at $15.78. GSG appears poised for an upside breakout above the 200-week SMA. The 12x3x3 weekly slow stochastic reading rose to 82.26 last week, up from 78.60 on March 8, moving above the overbought threshold of 80.00.
Nymex crude oil closed last week at $58.39 with a positive but overbought weekly chart as oil is above its five-week modified moving average at $56.00. Oil is above its 200-week or "reversion to the mean" at $52.00. The 12x3x3 weekly slow stochastics reading rose to 83.99 last week, up from 80.59 on March 8, rising further above the overbought threshold of 80.00. My semiannual and monthly value levels are $50.84 and $46.13 with my quarterly risky level at $60.16.
Investor Strategy: Buy GSG on weakness to my quarterly pivot at $15.60 and to my monthly value level at $14.44 and reduce holdings on strength to the 200-day simple moving average at $16.48.
The US dollar ETF is a basket of currencies that includes the dollar vs. Euro, Japanese Yen, British Pound, Canadian Dollar, Swedish Krona and Swiss Franc.
Invesco DB USD Bullish ETF (NYSEARCA:UUP)
 Courtesy of MetaStock Xenith
The dollar ETF ($25.80 on March 15) is up 1.4% so far in 2019 and up 11.6% since trading as low as $23.12 in early-2018. UUP has a positive weekly chart with the ETF above its five-week MMA of $25.74 and above its 200-week SMA or "reversion to the mean" of $25.02. The 12x3x3 weekly slow stochastic reading rose to 62.37 last week, up from 57.00 on March 8.
Investor Strategy: Buy weakness to my annual and quarterly value levels at $25.47 and $23.23, respectively, and reduce holdings on strength to my semiannual risky level at $26.39. My monthly pivot remains at $26.01.
Disclosure: I/we have no positions in any stocks mentioned, and no plans to initiate any positions within the next 72 hours. I wrote this article myself, and it expresses my own opinions. I am not receiving compensation for it (other than from Seeking Alpha). I have no business relationship with any company whose stock is mentioned in this article.
Follow Richard Suttmeier and get email alerts