The Gold ETF Is Struggling, Commodities Slip On Oil, As The Dollar Stays Strong
The Gold Shares ETF is struggling below a "death cross," but traders should buy weakness to my monthly and quarterly value levels of $111.60 and $110.26, respectively.
The Commodities ETF suffered a correction of 13.7% since setting its 2018 high of $18.81 on Oct. 3.
The Long Dollar ETF has been above a "golden cross" since May 31 and is approaching my risky level for November at $26.20.
Here are the daily charts for the gold, commodities and dollar exchange-traded funds.
The Gold Trust ETF tracks the spot price of gold and is said to be backed by gold bars in vaults in London.
SPDR Gold Trust (NYSEARCA:GLD)
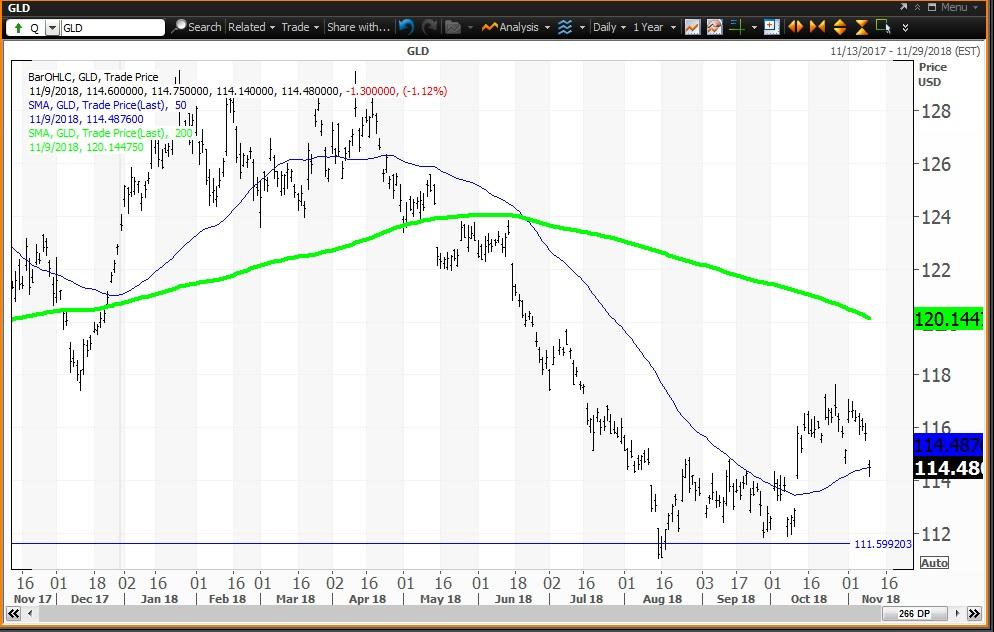
Courtesy of MetaStock Xenith
The Gold ETF ($114.48 on Nov. 9) is down 7.4% year to date, and its daily chart shows the ETF below a "death cross" which was confirmed on June 22 when the 50-day simple moving average fell below the 200-day simple moving average, indicating that lower prices would follow. This tracked the ETF to its 2018 low of $111.06 set on Aug. 15. The weekly chart is neutral with the ETF below its five-week modified moving average at $115.19 and below its 200-week simple moving average or "reversion to the mean" at $117.67 last tested during the week of Oct. 26. The 12x3x3 weekly slow stochastic reading rose to 68.38 last week, up from 66.43 on Nov. 9.
Investor Strategy: Buy weakness to my monthly, quarterly and semiannual value levels of $111.60, $110.26 and $103.62, respectively, and reduce holdings on strength to the 200-day simple moving average of $120.14. My annual risky level remains at $146.20.
The commodity ETF is heavily weighted to energy by about 60%.
iShares S&P GSCI Commodity-Indexed Trust ETF (NYSEARCA:GSG)
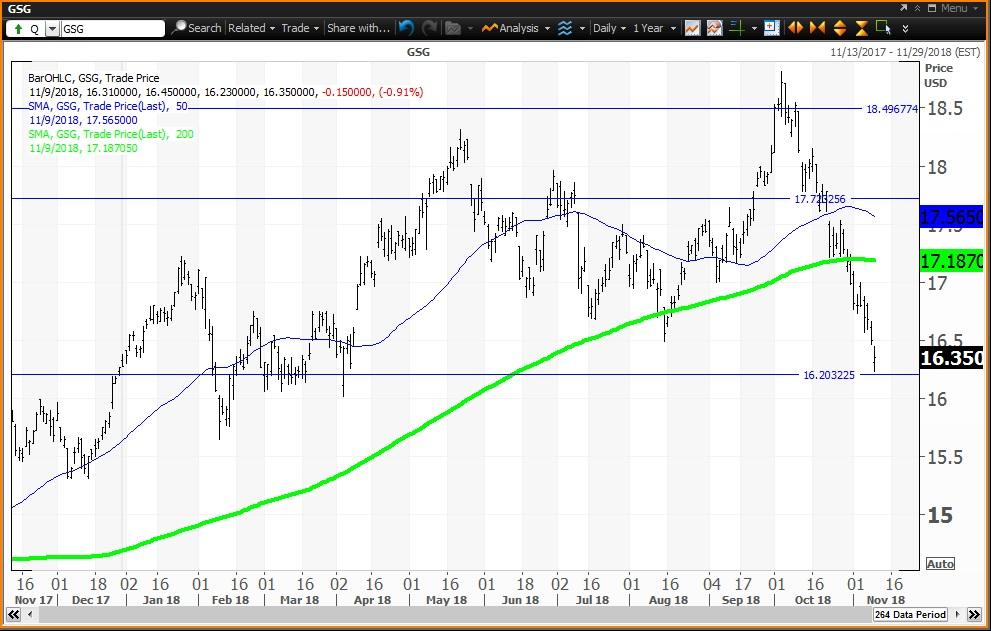
Courtesy of MetaStock Xenith
The Commodities ETF ($16.35 on Nov. 9) is up 0.4% year to date with the ETF down 13.7% from its Oct. 3 high of $18.81 down to $16.23 on Nov. 9. The ETF is below its 200-day SMA at $17.19. The weekly chart for the ETF is negative with GSG below its five-week MMA of $17.27 and above its 200-week SMA or "reversion to the mean" at $16.25. The 12x3x3 weekly slow stochastic reading slipped to 44.01 last week, down from 55.75 on Nov. 2.
Investor Strategy: Buy GSG on weakness to my annual value level at $16.20 and reduce holdings on strength to quarterly and monthly risky levels of $17.73 and $18.50, respectively.
The US Dollar ETF is a basket of currencies that includes the dollar vs. euro, Japanese yen, British pound, Canadian dollar, Swedish krona and Swiss franc.
PowerShares DB US Dollar Index Bullish ETF (NYSEARCA:UUP)

Courtesy of MetaStock Xenith
The Dollar ETF ($25.79 on Nov. 9) is up 7.3% year to date and has been above a "golden cross" since May 30 when the 50-day SMA rose above the 200-day SMA indicating that higher prices would follow, and the Oct. 31 high was $25.88. The weekly chart is positive with the ETF above its five-week MMA of $25.50 and above its 200-week SMA or "reversion to the mean" of $24.99. The 12x3x3 weekly slow stochastic reading rose to 75.34 last week, up from 69.33 on Nov. 7.
Investor Strategy: Buy weakness to my annual value level at $24.18 and reduce holdings on strength to my semiannual risky level of $28.65. The ETF is between my quarterly and monthly pivot of $25.20 and $26.20, respectively.
Disclosure: I/we have no positions in any stocks mentioned, and no plans to initiate any positions within the next 72 hours.
I wrote this article myself, and it expresses my own opinions. I am not receiving compensation for it (other than from Seeking Alpha). I have no business relationship with any company whose stock is mentioned in this article.
Follow Richard Suttmeier and get email alerts