The Gold ETF Stayed Above A Key Level; Commodities Hold Breakout As The Dollar Consolidates
The Gold Shares ETF stayed above its monthly pivot at $138.57 last week as the weekly chart remains positive but overbought.
The Commodities ETF broke out above its "reversion to the mean" at $15.41, which then held on weakness after trading as high as $16.26 last week.
The Long Dollar ETF failed at its monthly risky level at $26.99 at the Sept. 3 high, but remains well above its annual and semiannual pivots at $25.47 and $25.65, respectively.
Here are the weekly charts for the gold, commodities and the dollar ETFs.
The Gold Trust ETF tracks the spot price of gold and are said to be backed by gold bars in vaults in London.
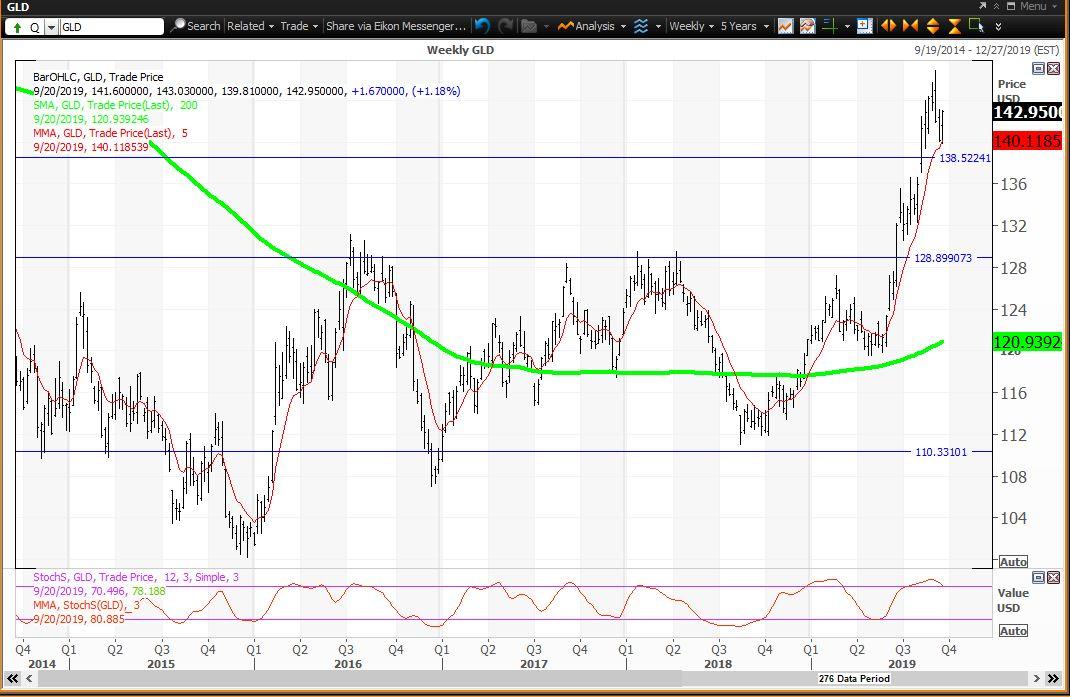
SPDR Gold Trust (NYSEARCA:GLD)
 Courtesy of Refinitiv XENITH
The Gold ETF ($142.95 on Sept. 20) is up 17.9% year to date and in bull market territory 28.7% above its Aug. 15, 2018, low of $111.06. The weekly chart remains positive but overbought with the ETF above its five-week modified moving average at $140.12 and above its 200-week simple moving average or "reversion to the mean" at $120.94. The 12x3x3 weekly slow stochastic reading slipped to 80.89 last week, down from 86.08 on Sept. 13. This reading was above 90.00 two weeks ago as an "inflating parabolic bubble" which corresponded to a weekly "key reversal" that occurred during the week of Sept. 6.
Investor Strategy: Buy weakness to its semiannual value level at $128.85. My monthly pivot for September is $138.57. The high of $146.82 set on Sept. 4 was a test of that week's risky level of $146.36 where profits were taken. The Sept. 9, 2011, high remains at $185.85.
The Commodity ETF is heavily weighted to energy by about 60%.
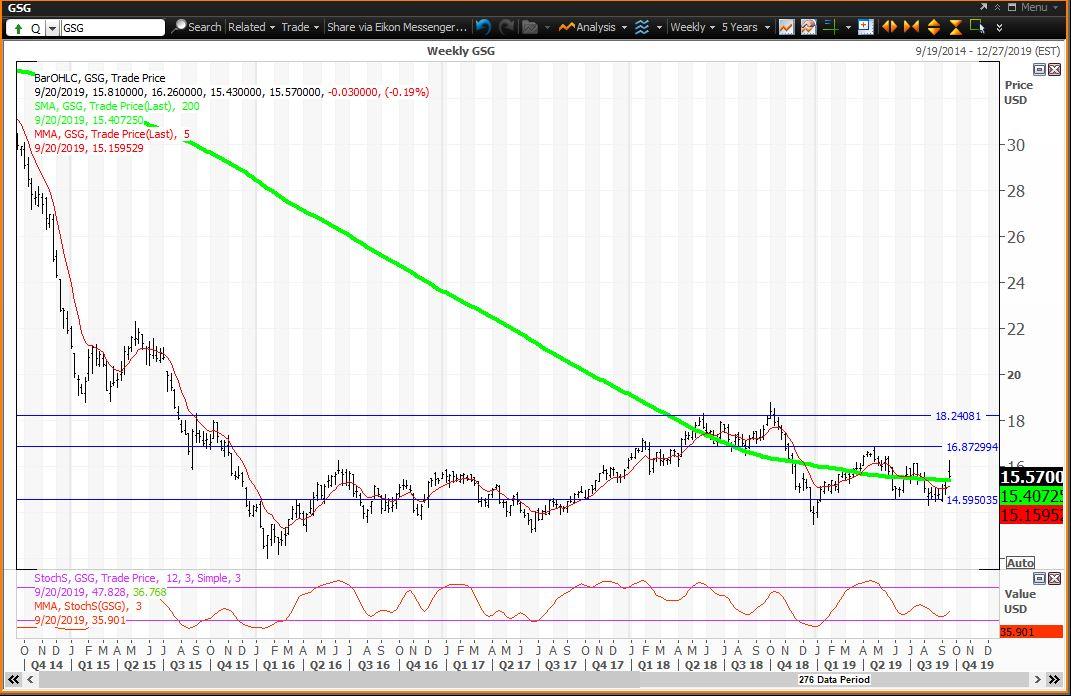
iShares S&P GSCI Commodity-Indexed Trust ETF (NYSEARCA:GSG)
 Courtesy of Refinitiv XENITH
The Commodities ETF ($15.57 on Sept. 20) is up 11.1% year to date and up 15.3% since its Dec. 26 low of $13.50. This ETF is 7.5% below its 2019 high of $16.83 set on April 22. The weekly chart is positive with the ETF above its five-week modified moving average at $15.16. Last week's gap above its 200-week simple moving average or "reversion to the mean" at $15.41 was a technical breakout that held this key moving average. The 12x3x3 weekly slow stochastic reading rose to 35.90 last week, up from 29.94 on Sept. 13.
Investor Strategy: Buy weakness to the weekly value level at $14.40 and reduce holdings on strength to its monthly and quarterly risky levels at $16.99 and $18.23, respectively.
The weekly chart for Nymex crude oil ($58.09 on Sept. 20) after spiking as high as $63.38 on Sept. 16. The weekly chart is positive with oil above its five-week modified moving average at $56.13 and above its 200-week simple moving average or "reversion to the mean" at $53.47. The 12x3x3 weekly stochastic reading rose to 46.35 last week, up from 43.19 on Sept. 13. The widespread divergence between its semiannual and annual value levels at $47.93 and $38.76, respectively, and its monthly and quarterly risky levels at $68.34 and $75.38, respectively, explains this huge spike in volatility.
The US Dollar ETF is a basket of currencies that includes the dollar vs. euro, Japanese yen, British pound, Canadian dollar, Swedish krona and Swiss franc.
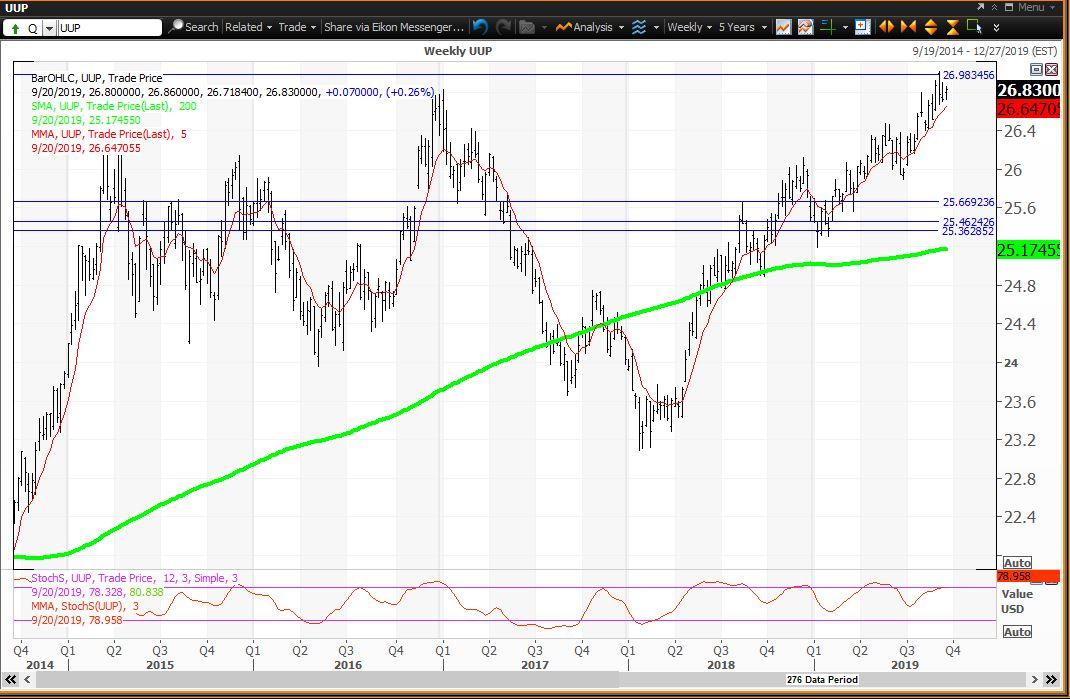
PowerShares DB US Dollar Index Bullish ETF (NYSEARCA:UUP)
 Courtesy of Refinitiv XENITH
The Dollar ETF ($26.83 on Sept. 20) is up 5.4% year to date and up 16% since trading as low as $23.12 in early-2018. A multiyear intraday high of $27.01 was set on Sept. 3 and was a test of this month's risky level at $26.99. The weekly chart is neutral with the ETF above its five-week modified average at $26.64 and above its 200-week simple moving average or "reversion to the mean" at $25.17. The 12x3x3 weekly slow stochastic reading slipped to 78.96 last week down from 79.27 on Sept. 13.
Investor Strategy: Buy weakness to its annual value level at $25.47 and to its 200-week SMA at $25.17. Investors reduced holdings on strength to its monthly risky level at $26.99 two weeks ago and that continues to be the strategy this week. Annual and semiannual pivots are $25.47 and $25.65, respectively.
How to use my value levels and risky levels
Value levels and risky levels are based upon the last nine weekly, monthly, quarterly, semiannual and annual closes. The first set of levels was based upon the closes on Dec. 31. The original annual level remains in play.
The weekly level changes each week. The monthly level changes at the end of each month, the latest on Aug. 30. The quarterly level was changed at the end of June.
My theory is that nine years of volatility between closes are enough to assume that all possible bullish or bearish events for the stock are factored in.
To capture share price volatility investors should buy on weakness to a value level and reduce holdings on strength to a risky level. A pivot is a value level or risky level that was violated within its time horizon. Pivots act as magnets that have a high probability of being tested again before its time horizon expires.
How to use 12x3x3 Weekly Slow Stochastic Readings
My choice of using 12x3x3 weekly slow stochastic readings was based upon back-testing many methods of reading share-price momentum with the objective of finding the combination that resulted in the fewest false signals. I did this following the stock market crash of 1987, so I have been happy with the results for more than 30 years.
The stochastic reading covers the last 12 weeks of highs, lows and closes for the stock. There is a raw calculation of the differences between the highest high and lowest low versus the closes. These levels are modified to a fast reading and a slow reading, and I found that the slow reading worked the best.
The stochastic reading scales between 00.00 and 100.00 with readings above 80.00 considered overbought and readings below 20.00 considered oversold. Recently I noted that stocks tend to peak and decline 10% to 20% and more shortly after a reading rises above 90.00, so I call that an "inflating parabolic bubble" as a bubble always pops. I also call a reading below 10.00 as being "too cheap to ignore."
Disclosure: I/we have no positions in any stocks mentioned, and no plans to initiate any positions within the next 72 hours. I wrote this article myself, and it expresses my own opinions. I am not receiving compensation for it (other than from Seeking Alpha). I have no business relationship with any company whose stock is mentioned in this article.
Follow Richard Suttmeier and get email alerts