The Silver/Gold Ratio Sends A Signal
The ratio provides clues.
Silver got very cheap compared to gold.
Silver is not the only precious metal that is lagging the yellow metal.
The ratio weighed on the sector.
A recent turn around could mean higher prices in the coming weeks and months.
In around 3000 BC the first Egyptian Pharaoh Menes declared that two-and-one-half parts silver equal one-part gold. In those days, gold and silver were leading means of exchange and symbols of wealth and power. The Egyptian leader established a price relationship that exits today. Both gold and silver are precious metals. However, gold is rarer and perhaps more importantly, more lustrous than silver, so it has been like the bills and silver has taken the role of change. I remember when I was a kid, my grandfather often called the change in his pocket silver. In the 1960's many quarters and dimes contained silver metal.
In 2018, the price of silver has lagged gold as the silver/gold ratio rose far above its long-term media at around the 55:1 level. For over four decades, the average level of the price of gold divided by the price of silver stands at around fifty ounces of silver value in each ounce of the yellow metal.
The ratio provides clues
While there is a lot more to the path of least resistance for both gold and silver than their price relationship to one and other, the ratio can provide valuable clues at times. I believe that the only way to classify a commodity as cheap or expensive is by comparing its historical price to another raw material that is similar or could be a substitute. Gold and silver are both precious metals with long histories as metals and financial assets. Therefore, a comparison of their prices can tell us where they stand today compared to in past years. Gold and silver each have individual supply and demand characteristics as well as different influences that drive visible and nonvisible inventory levels. However, both are precious metals that tend to thrive during periods of fear and uncertainty and when inflationary pressures are present in the global economy.
In the days of ancient Egypt, two and one-half to one was the value relationship between silver and gold according to the Pharaoh. However, in modern times the median level is much higher. 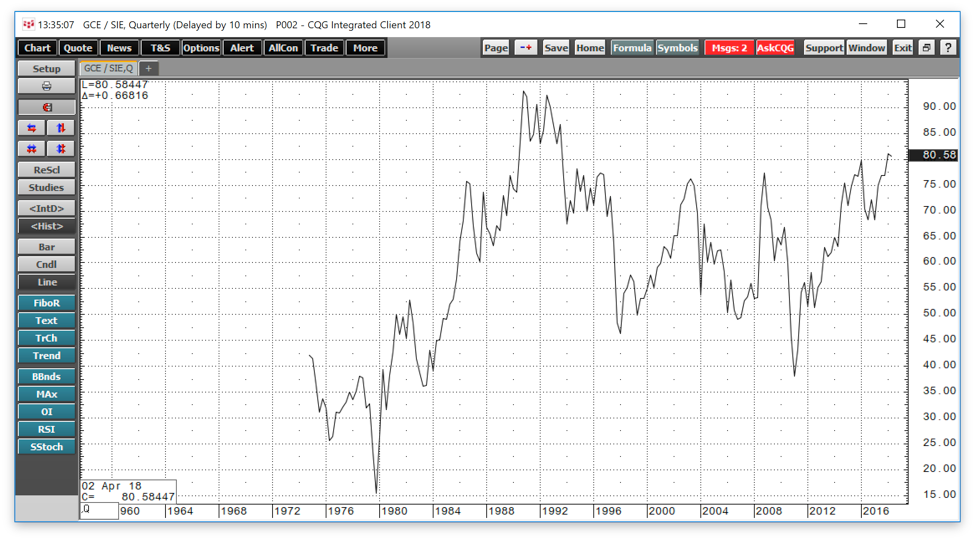
Source: CQG
As the quarterly chart highlights the median level for the relationship is around fifty-five ounces of silver value in each ounce of gold value. When the ratio is below the median, silver is historically expensive compared to the price of gold. We witnessed low level in 1980 and 2011 when the price of silver traded to, or near, its all-time high. When the ratio is above the median, silver is historically cheap compared to the price of gold, and that has been the case since 2013.
Silver got very cheap compared to gold
The monthly chart illustrates that silver has been losing ground to gold since 2013. 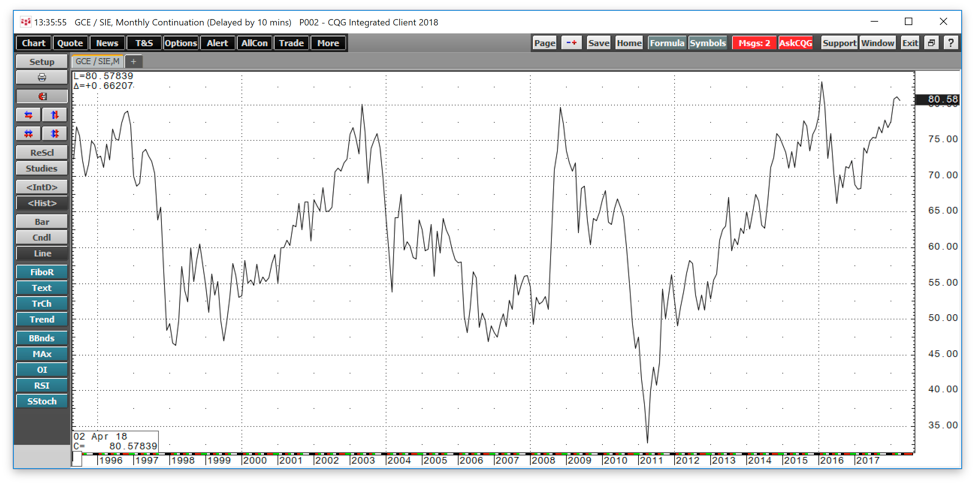
Source: CQG
As the chart shows, the ratio has been steadily rising since 2011, reaching its high at 83.1745:1 in February 2016. Since then, it traded in a range from 66.21:1 to 81.09:1 and was at just over 80:1 on April 27. Silver got very cheap compared to gold, and on a historical basis, it remains undervalues compared to the yellow metal. Either silver is too cheap, gold is too expensive, or a bit of both these days when it comes to the historical price relationship between the metals. Meanwhile, silver is not the only precious metal that is lagging the price of gold these days.
Silver is not the only precious metal that is lagging the yellow metal
Platinum is the rarest precious metal that trades on the U.S. futures exchanges in that it has the lowest annual output and the highest cost of production. Platinum is both a precious and an industrial metal and it has many more industrial applications on a per-ounce produced basis than the other lustrous metals. 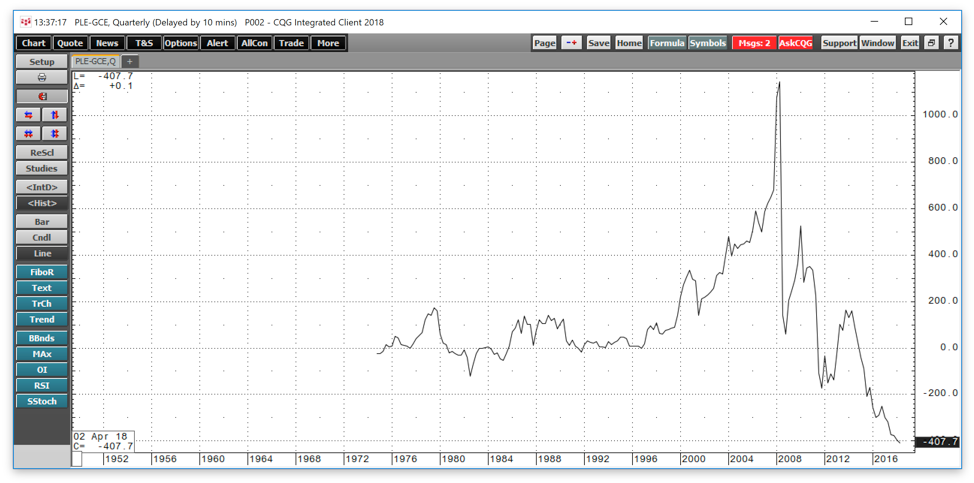
Source: CQG
As the chart displays, platinum has not traded at a premium to the price of gold since 2014. Platinum's nickname is "rich man's gold," but it has been anything but that over the past four years. In 2018, the discount of platinum under gold dropped to and remains at the lowest level in modern history when compared to gold. At over a $400 discount to the yellow metal, platinum is downright cheap these days on a historical basis.
The ratio weighed on the sector
Gold hit its high in July 2016 when the price of nearby COMEX futures hit $1377.50 per ounce. 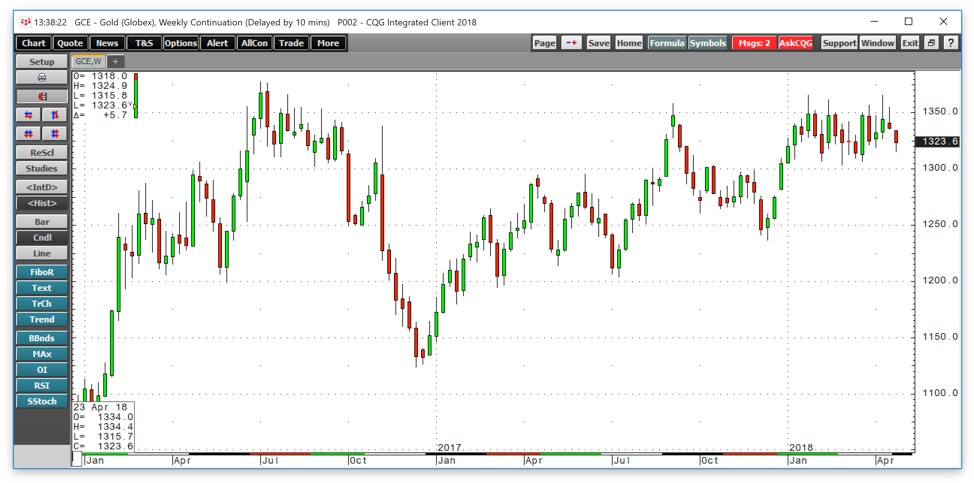
Source: CQG
As the weekly chart shows, gold corrected after the 2016 peak and moved to a low of $1123.90 per ounce in late 2016. However, the yellow metal has been making higher lows since and recently it has been flirting with a test of the 2016 post-Brexit high. On the weekly chart, gold traded to a high of $1365.40 per ounce during the weeks of January 22 and April 9, 2018, putting in a double top on the weekly pictorial. However, the comparative weakness in silver has likely weighed on the price of gold. Silver reached a high of $21.095 in July 2016 and platinum got to a peak of $1199.50 per ounce. Both metals are nowhere near their 2016 highs, while gold remains above the $1300 per ounce level. It is likely that the silver/gold ratio and the platinum-gold spread both weighed on prices of metals within the precious sector.
A recent turn around could mean higher prices in the coming weeks and months
Silver had been trading in a range between $16 and $17 per ounce since early February, but last week a round of short-covering going into the May-July futures roll on COMEX caused silver to move to the upside and above the $17 level reaching a high of $17.36 on April 19. The price fell back to lows of $16.46 on April 26, but the price action in the silver/gold ratio could be a clue that silver is gaining on gold which could support precious metals prices in the coming weeks and months. 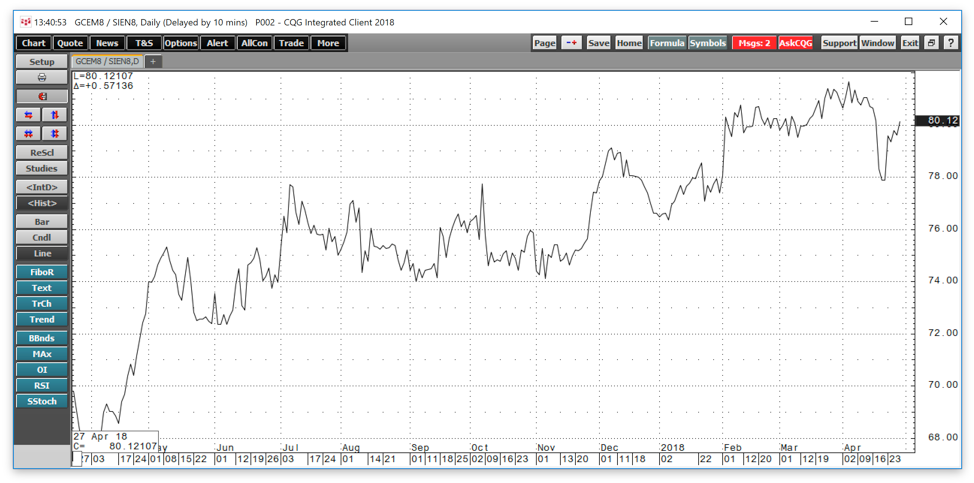
Source: CQG
As the daily chart shows, the silver/gold ratio fell from 81.65:1 on April 4 to lows of 77.88:1 on April 20 and was at just over the 80:1 level on April 27. The level to watch on the price relationship is down at 76.36:1 the early 2018 low which is critical technical support for the ratio these days. A move below that level would end the pattern of higher lows and higher highs that has been in place since July 2016. If the ratio were to fall below the 76:1 level it could spark a speculative charge into the precious metals sector, so I will be watching that level and the ratio like a hawk over coming days and weeks.
Silver can be a highly volatile metal, and I have been using the triple leveraged silver ETN product, USLV to take advantage of price moves in the silver market. 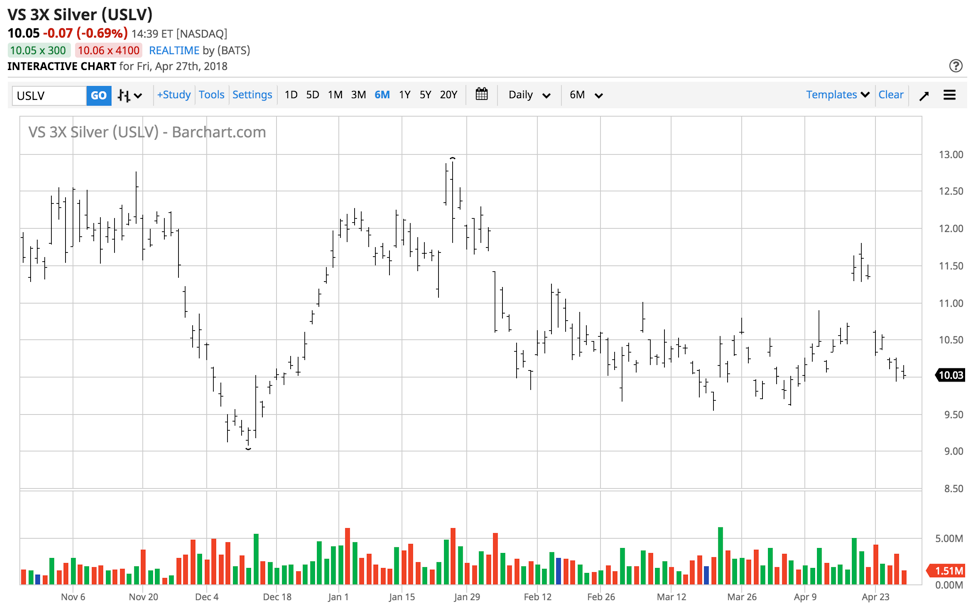
Source: Barchart
USLV was trading at the $10.05 per share level on April 27 after the price of silver came back down below the $17 level. Precious metals have also been highly sensitive to moves in the U.S. dollar, and a rally back above the 91 level over past sessions have weighed on prices and could be offering market participants another chance to buy silver on a dip.
The silver/gold ratio sent us a signal last week as it dropped below the 80:1 level. A move down below the 75:1 level could have significant ramifications for the price of precious metals over coming weeks and months.
The Hecht Commodity Report is one of the most comprehensive commodities reports available today from the #2 ranked author in both commodities and precious metals. My weekly report covers the market movements of 20 different commodities and provides bullish, bearish and neutral calls; directional trading recommendations, and actionable ideas for traders. More than 120 subscribers are deriving real value from the Hecht Commodity Report.
Disclosure: I/we have no positions in any stocks mentioned, and no plans to initiate any positions within the next 72 hours.
I wrote this article myself, and it expresses my own opinions. I am not receiving compensation for it (other than from Seeking Alpha). I have no business relationship with any company whose stock is mentioned in this article.
Additional disclosure: The author always has positions in commodities markets in futures, options, ETF/ETN products, and commodity equities. These long and short positions tend to change on an intraday basis.
Follow Andrew Hecht and get email alerts