The Technical Picture For The Gold Market
A break outside of a multiyear range in June.
The daily chart - bullish reversals have been good indicators.
The weekly chart - an overbought condition, but open interest is rising.
A semi-annual picture - new highs could be on the horizon.
Gold equities support higher prices - UGLD on dips to turbocharge performance.
Gold is shining as an asset these days since the luster returned in June. After trading in a range since 2014, the price of gold experienced a technical break to the upside in June. Many fundamental factors support higher gold prices these days. Lower interest rates in the US and around the world reduce the cost of holding gold and increase its attraction versus other assets. Central banks around the world have been net buyers of the yellow metal providing price support during corrective periods.
Moreover, gold's role as an asset that thrives during periods of fear and uncertainty has caused buying to intensify. The escalation of the trade and currency war between the US and China, Hong Kong, Brexit and European economic weakness, Iran, and even political divisiveness in the United States all create an environment where gold's profile has risen. The old question, which came first, the chicken or the egg, may be appropriate for the gold market. Some may argue that fundamentals caused the shift in sentiment while others could counter than changing sentiment has improved the fundamentals. Whichever it is, the herd is buying gold these days, and the price is making higher highs.
The technical picture for gold is looking highly bullish and could even lead to a challenge of the modern-day high from 2011 at $1920.70 per ounce. The price of the yellow metal has already moved more than halfway. At $1520 per ounce, it was trading at $473.80 above the late 2015 low and $400.70 below the 2011 record peak.
If gold is a bullish rocket ship that is going to continue to make great strides on the upside, the Velocity Shares 3X Long Gold ETN (UGLD) will magnify the price action so long as the bullish ride continues.
A break outside of a multiyear range in June
In hindsight, the breakout in the gold market above the July 2016 high at $1377.50 per ounce was a significant event for the yellow metal.
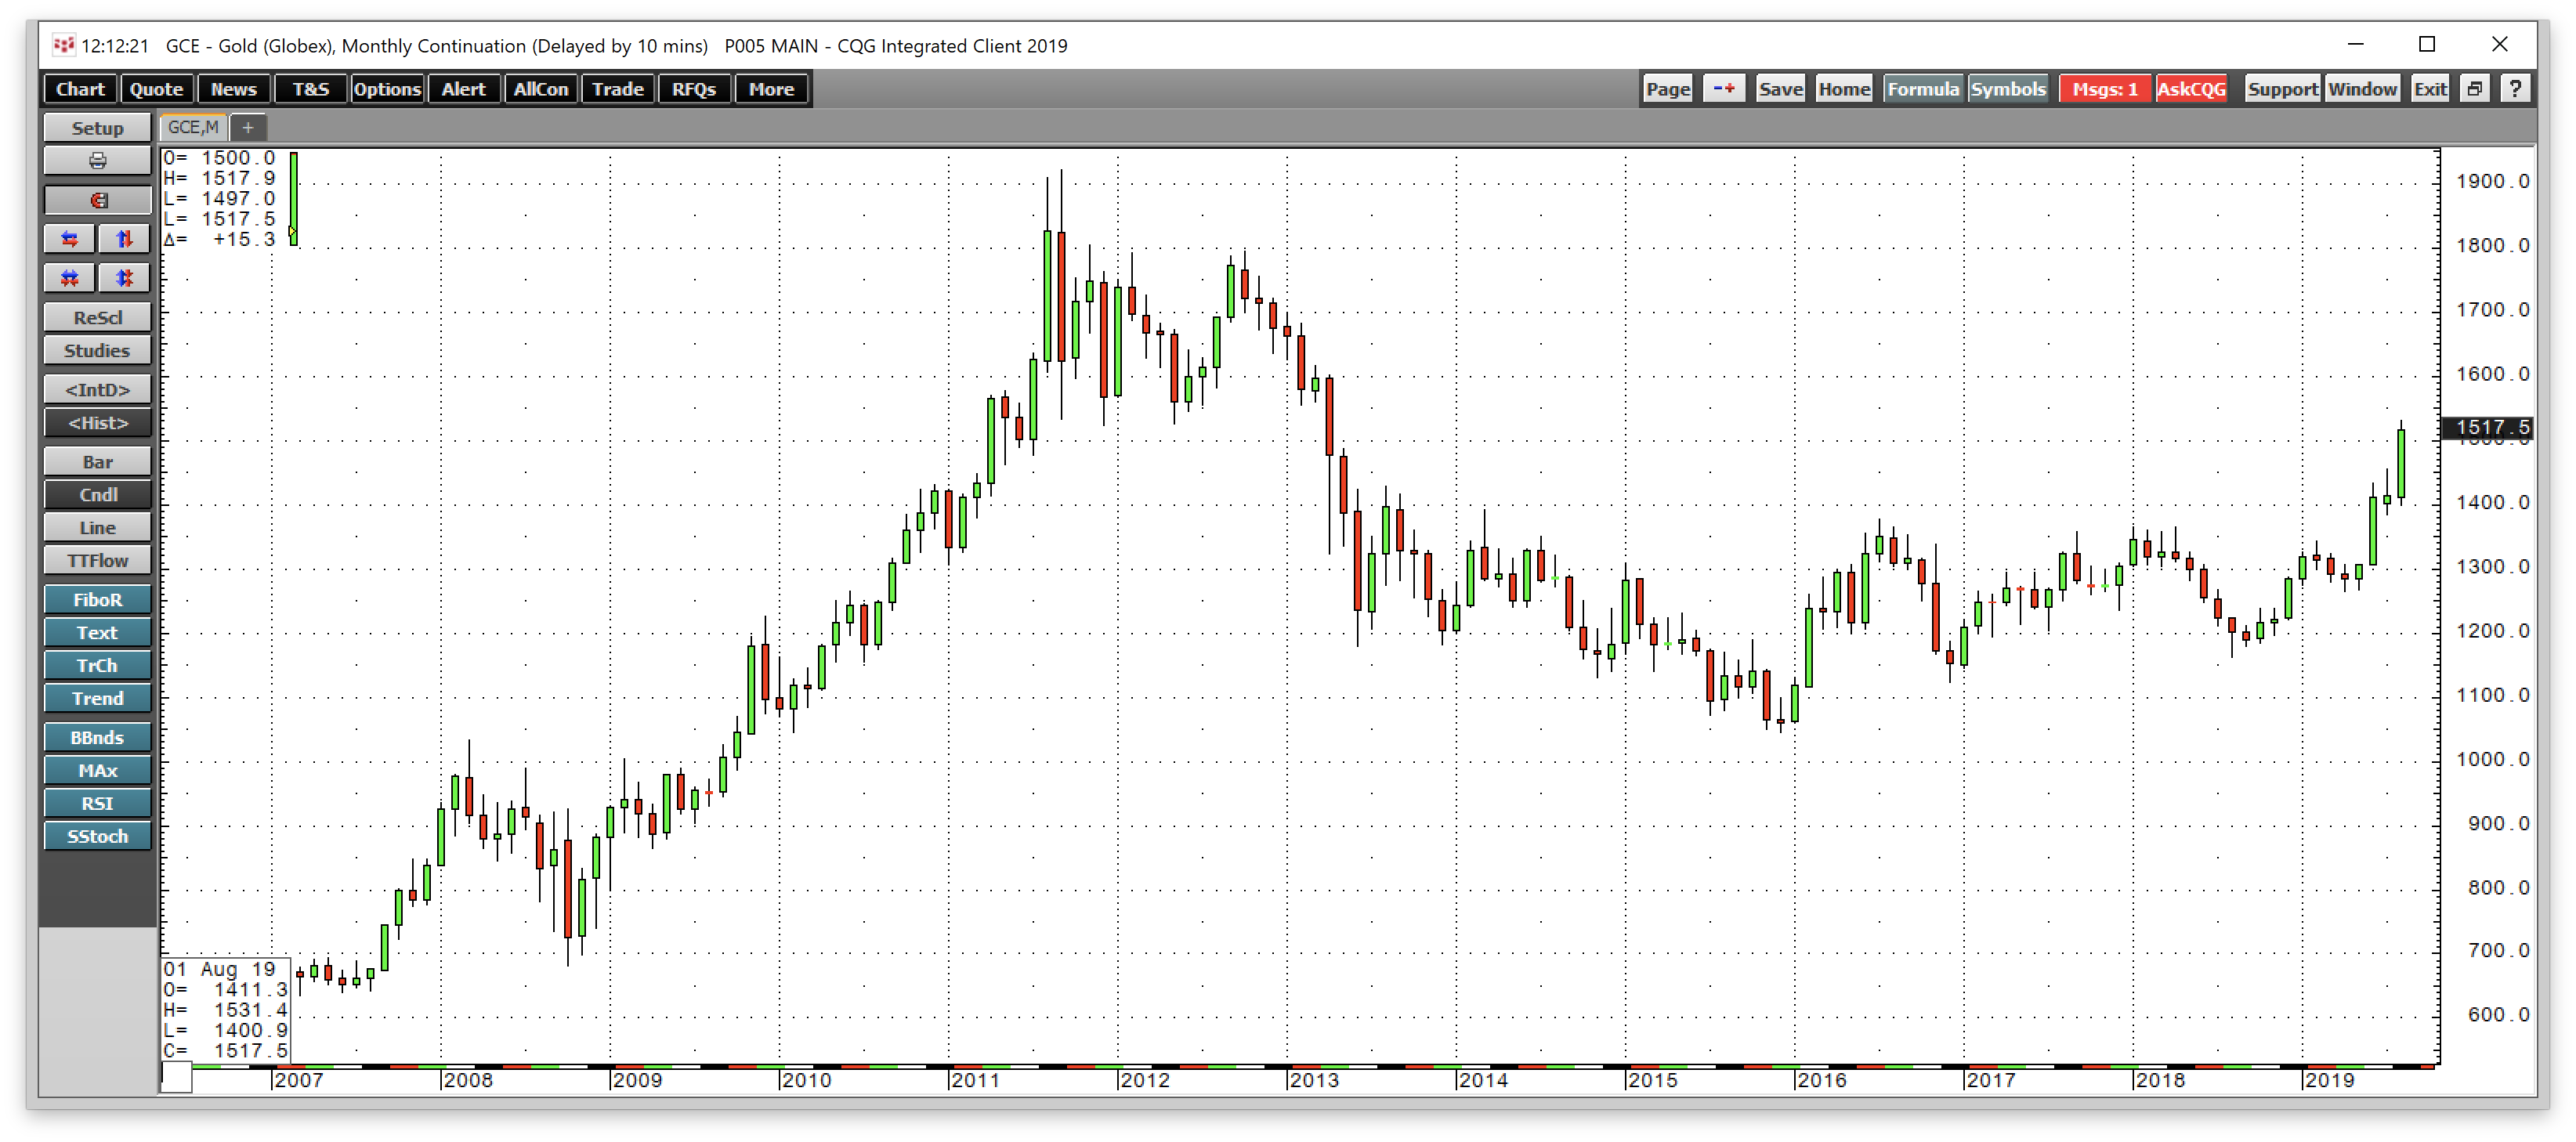
Source: CQG
The monthly chart shows that gold traded in a $331.30 range from April 2014 through June 2019. The yellow metal fell to a bottom at $1046.20 in December 2015 and hit a high at $1377.50 in July 2016. The lows came as all commodities prices hit their bottoms in late 2015 and early 2016. The peak in gold occurred in the aftermath of the Brexit referendum in the UK, which injected fear and uncertainty into markets.
In June 2019, the Fed told markets to expect short-term interest rates in the US to decline. The pivot towards an accommodative path for monetary policy following four rate hikes of 25 basis points apiece in 2018 was followed by the technical breakout in gold as the price climbed above the $1377.50 per ounce level.
The daily chart - bullish reversals have been good indicators
The price of gold continued to rally after the technical break in June, and the daily chart displays three bullish reversals in July and August.
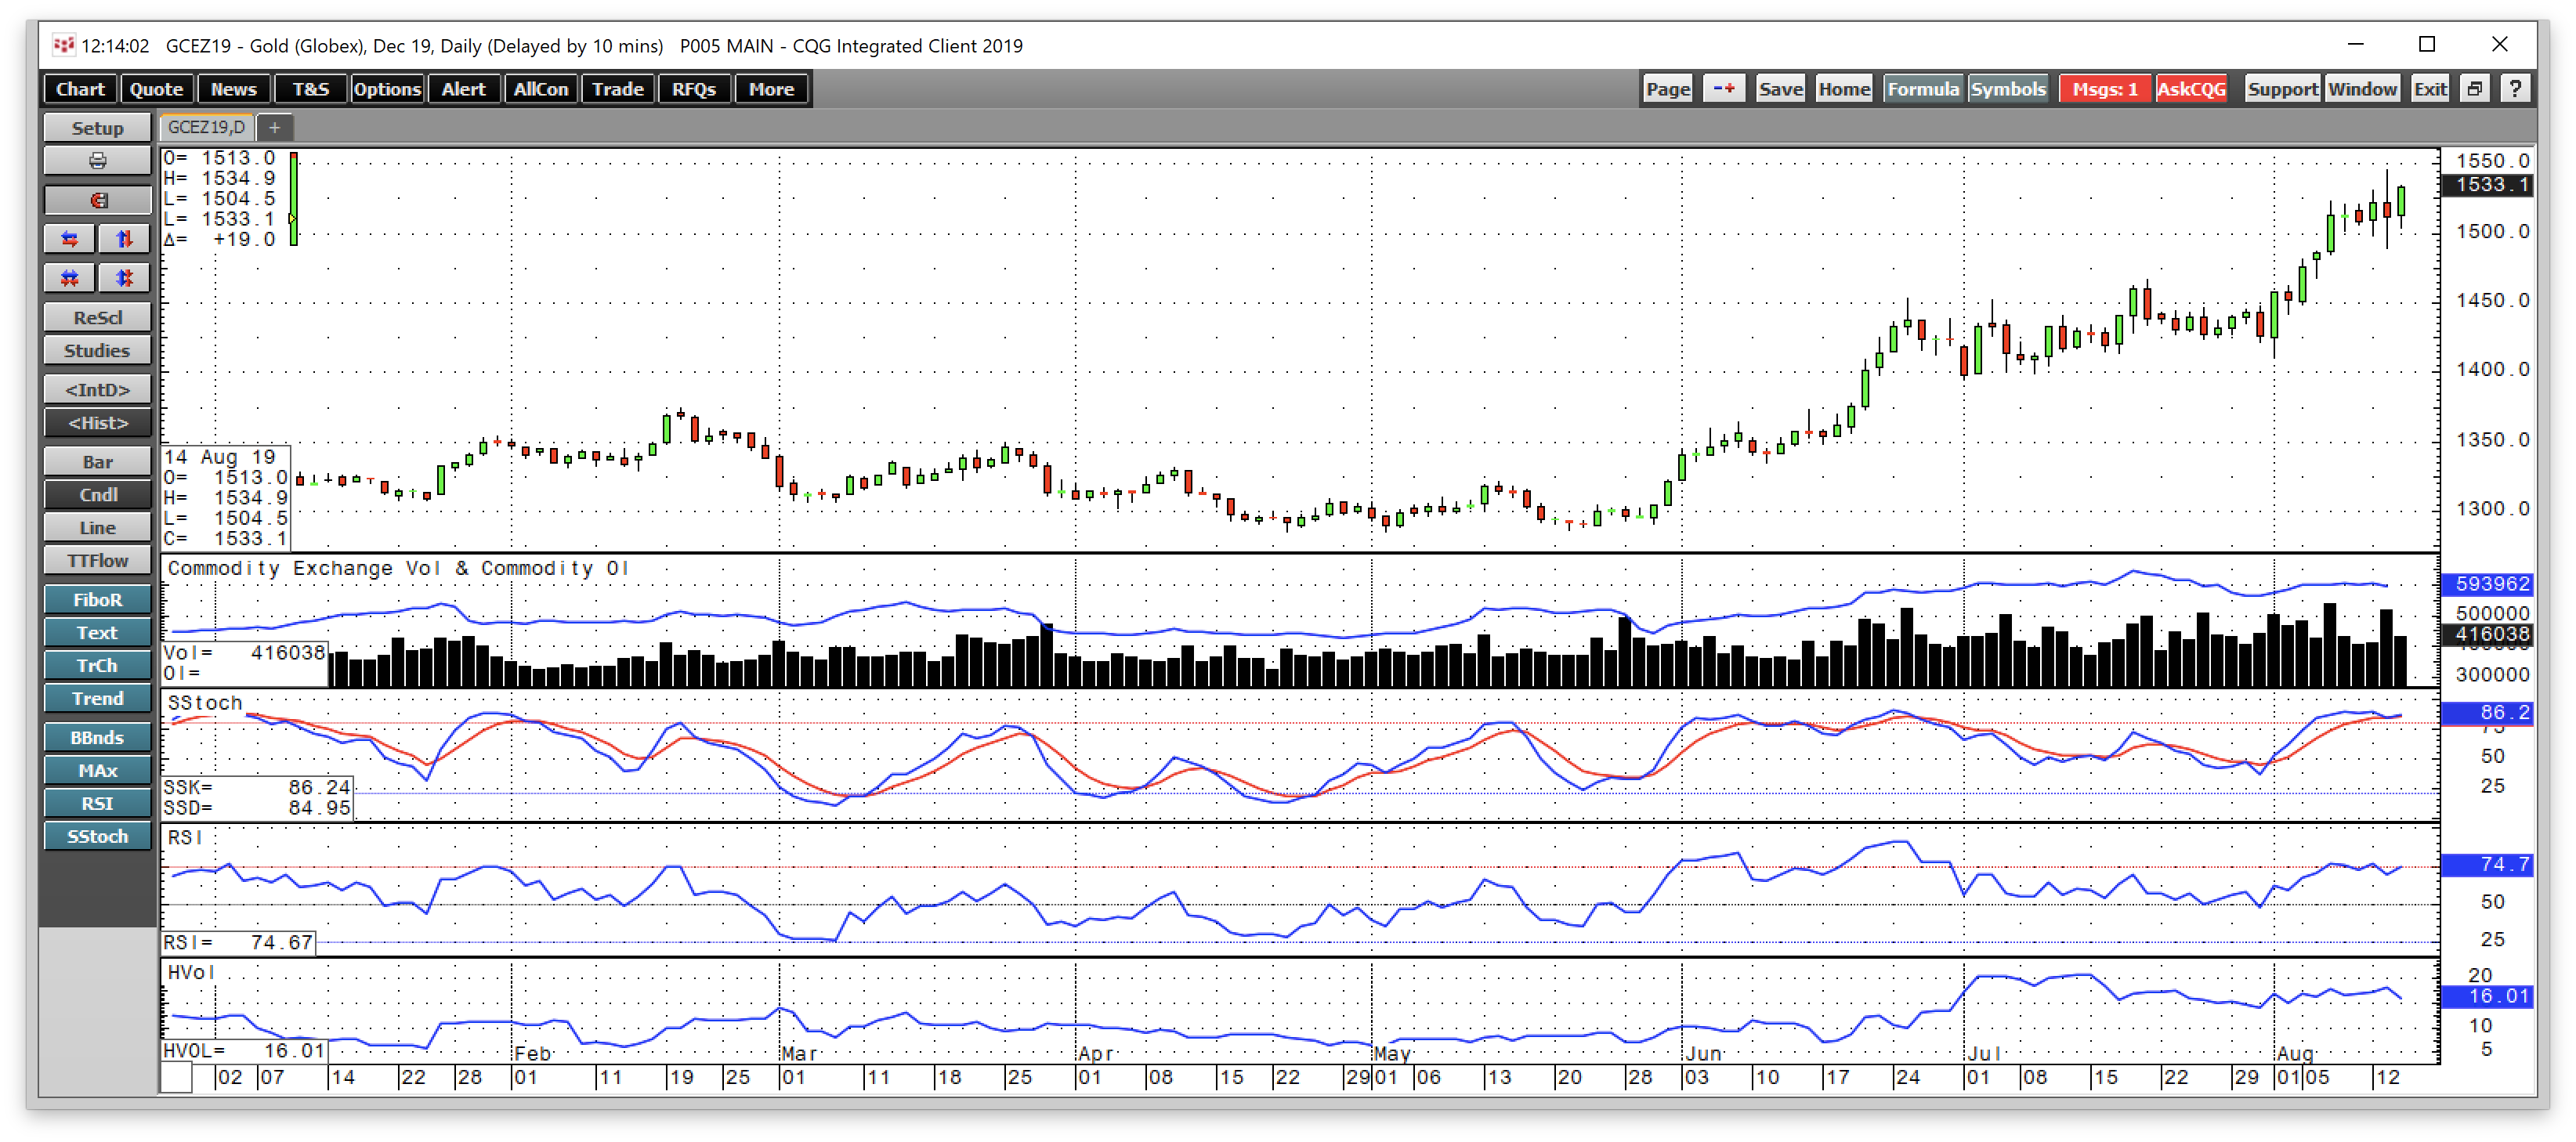
Source: CQG
The first bullish reversal occurred on July 17. On August 1 and 12 gold traded below the low of the previous session and closed at above the prior day's high. On Monday, August 12, the price rose to a high at $1531.50 on the active month December futures contract.
Both price momentum and relative strength indices are in overbought territory, and daily historical volatility has risen to the 16% level. Open interest, the total number of open long and short positions in the COMEX gold futures market has been at either side of the 600,000-contract level since early July. The all-time peak in the metric was at a bit over the 620,000 level. Increased open interest and rising price is a technical validation of the short-term bullish trend in the gold market. While gold displays an overbought condition, the short-term technical picture remains bullish.
The weekly chart - an overbought condition, but open interest is rising
The weekly technical picture for gold displays a strong bullish trend that does not differ all that much from the daily chart.
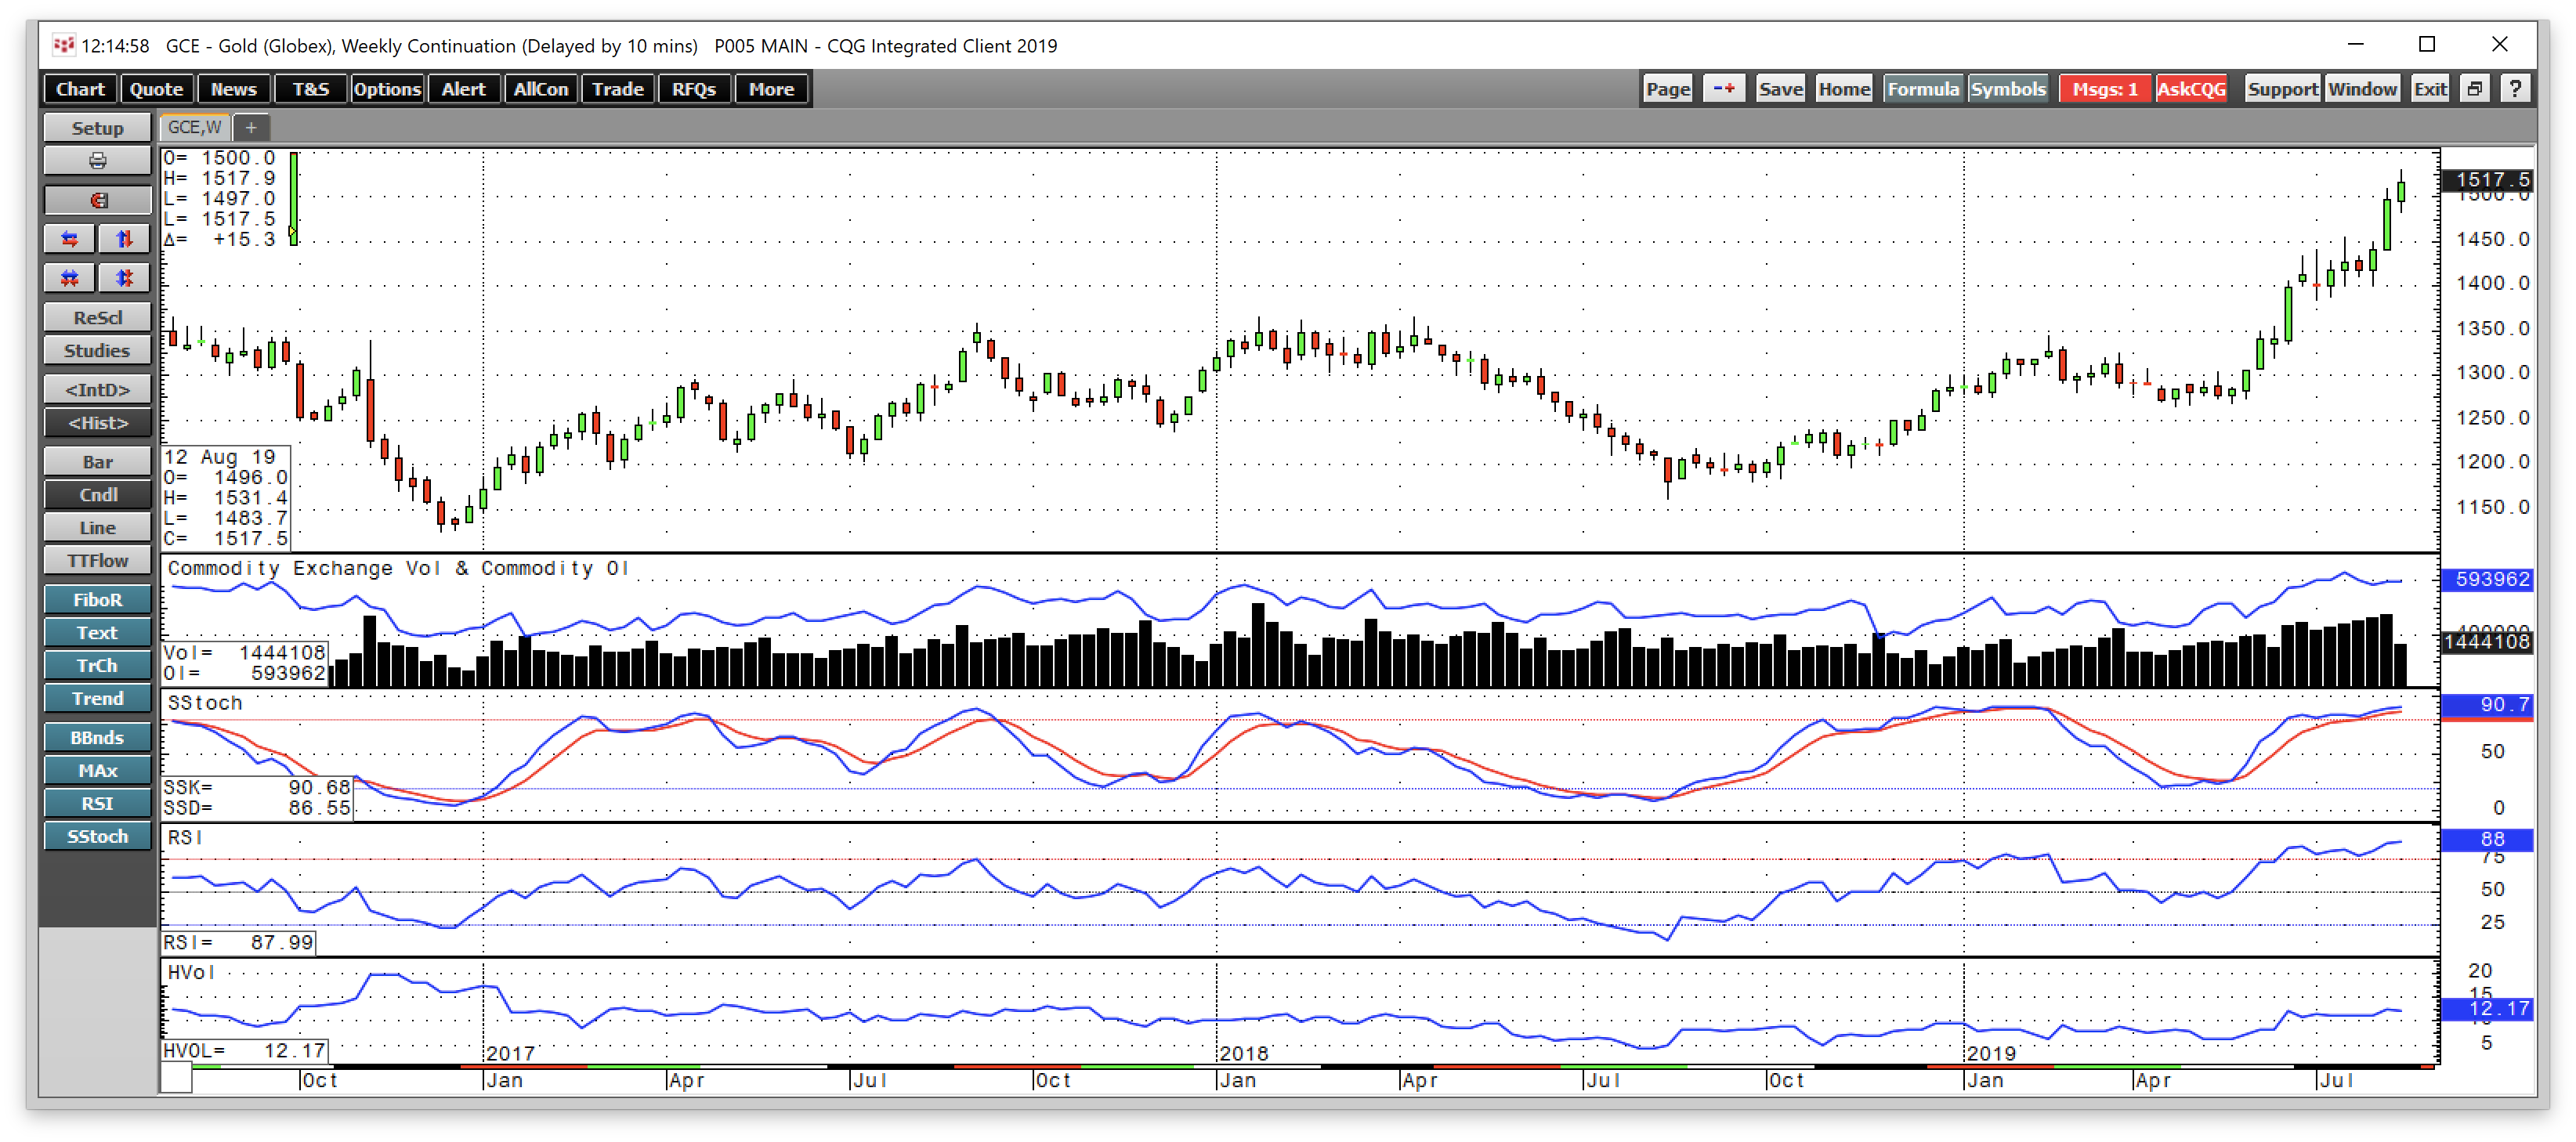
Source: CQG
While momentum and strength indices are in overbought territory, and open interest is rising with price, the weekly measure of price variance is at 12.17%. Gold is a hybrid between a commodity and a currency, so historical price volatility tends to be higher than in currency markets and lower than in the commodities market. At just over 12%, the metric reflects no significant price spikes in the gold market on the up or the downside. However, over the past thirteen weeks, gold has posted eleven weeks of gains. The two weeks when the price of gold pulled back and closed lower than the previous week, the losses were marginal.
A bull market can last for a prolonged period. There are few signs that gold's path of least resistance is in danger of reversing any time soon. On the weekly pictorial, gold put in a key reversal during the week of July 29 when it fell to almost the $1400 level, but it rejected that low and has moved over $116 per ounce higher since the low on August 1.
A semi-annual picture - new highs could be on the horizon
The long-term semi-annual chart for the gold futures market could present the most bullish technical case for the precious metal.
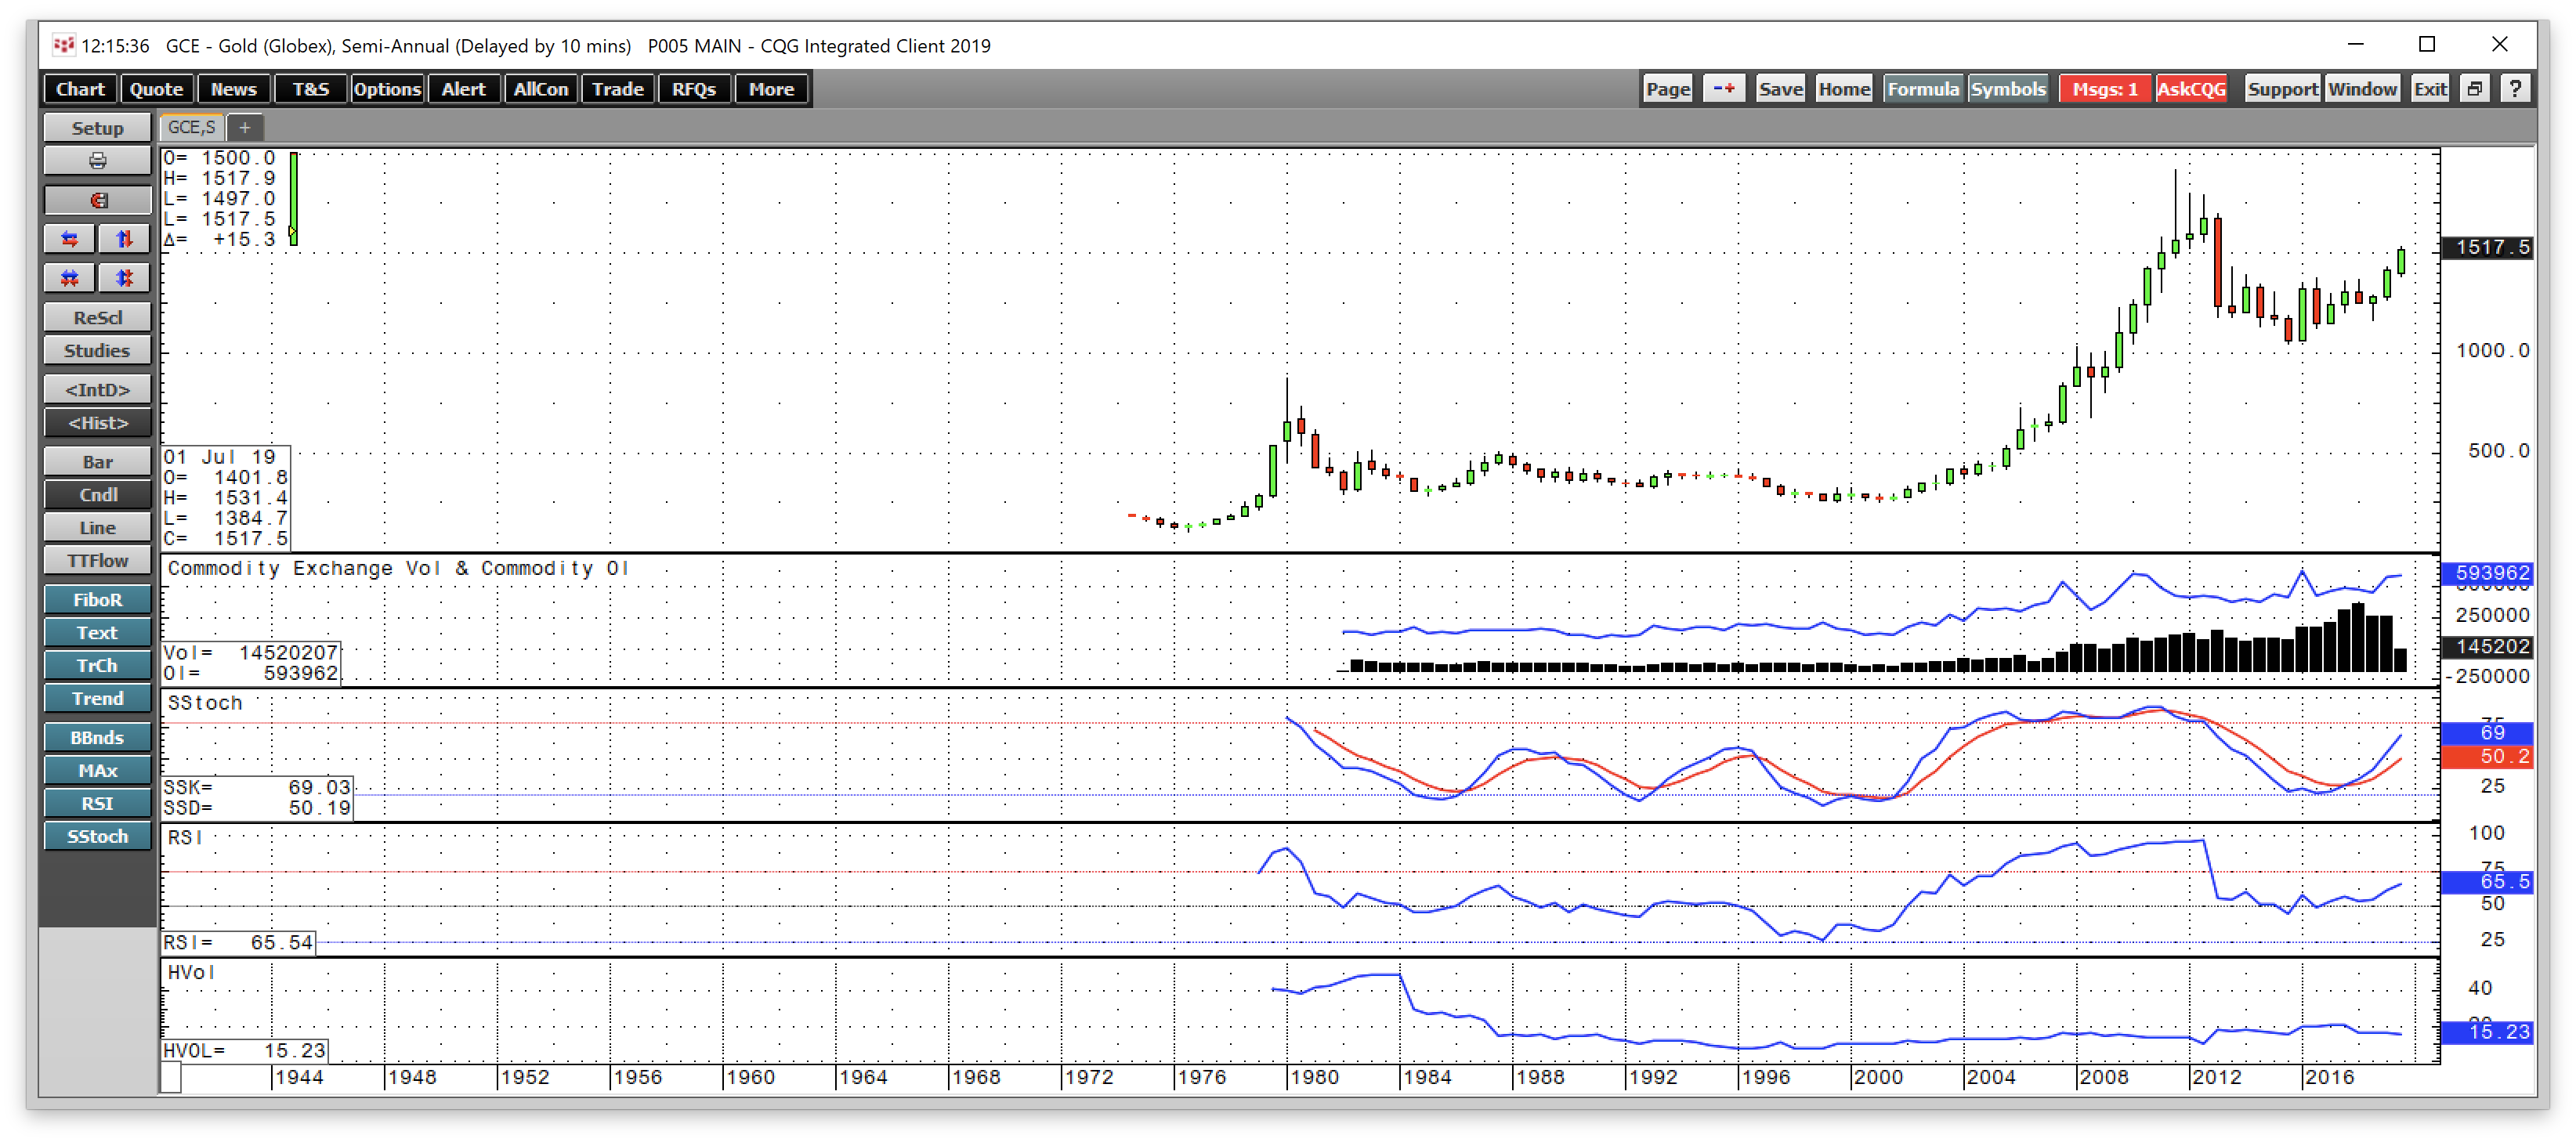
Source: CQG
As the chart displays, gold posted gains over the past three consecutive six-month periods. Momentum and strength indicators are rising but have not yet reached overbought conditions. Moreover, gold remained in overbought territory from 2006 through 2012. The recent move that has taken gold to its highest price since 2013 is looking like the next leg to the upside in a bull market that started back in 2005.
Gold equities support higher prices - UGLD on dips to turbocharge performance
I have pointed out in other pieces for Seeking Alpha that gold is not only rallying in dollars but in all other currencies. While the target on the upside in dollar terms is at $1920.70, the 2011 high, in euro and Swiss franc terms, gold is closer to its record levels on a percentage basis at its current price. In Japanese yen, British pounds, Canadian and Australian dollar, Chinese yuan, Russian rubles, and a host of other currencies, the yellow metal is already at a record high and continues to rise in value. Currencies support the bull market trend in the gold market from a technical perspective.
Gold mining shares typically outperform the price of the precious metal during bull markets. The GDX and GDXJ are the two ETF products that hold shares in the leading major and junior gold mining companies.
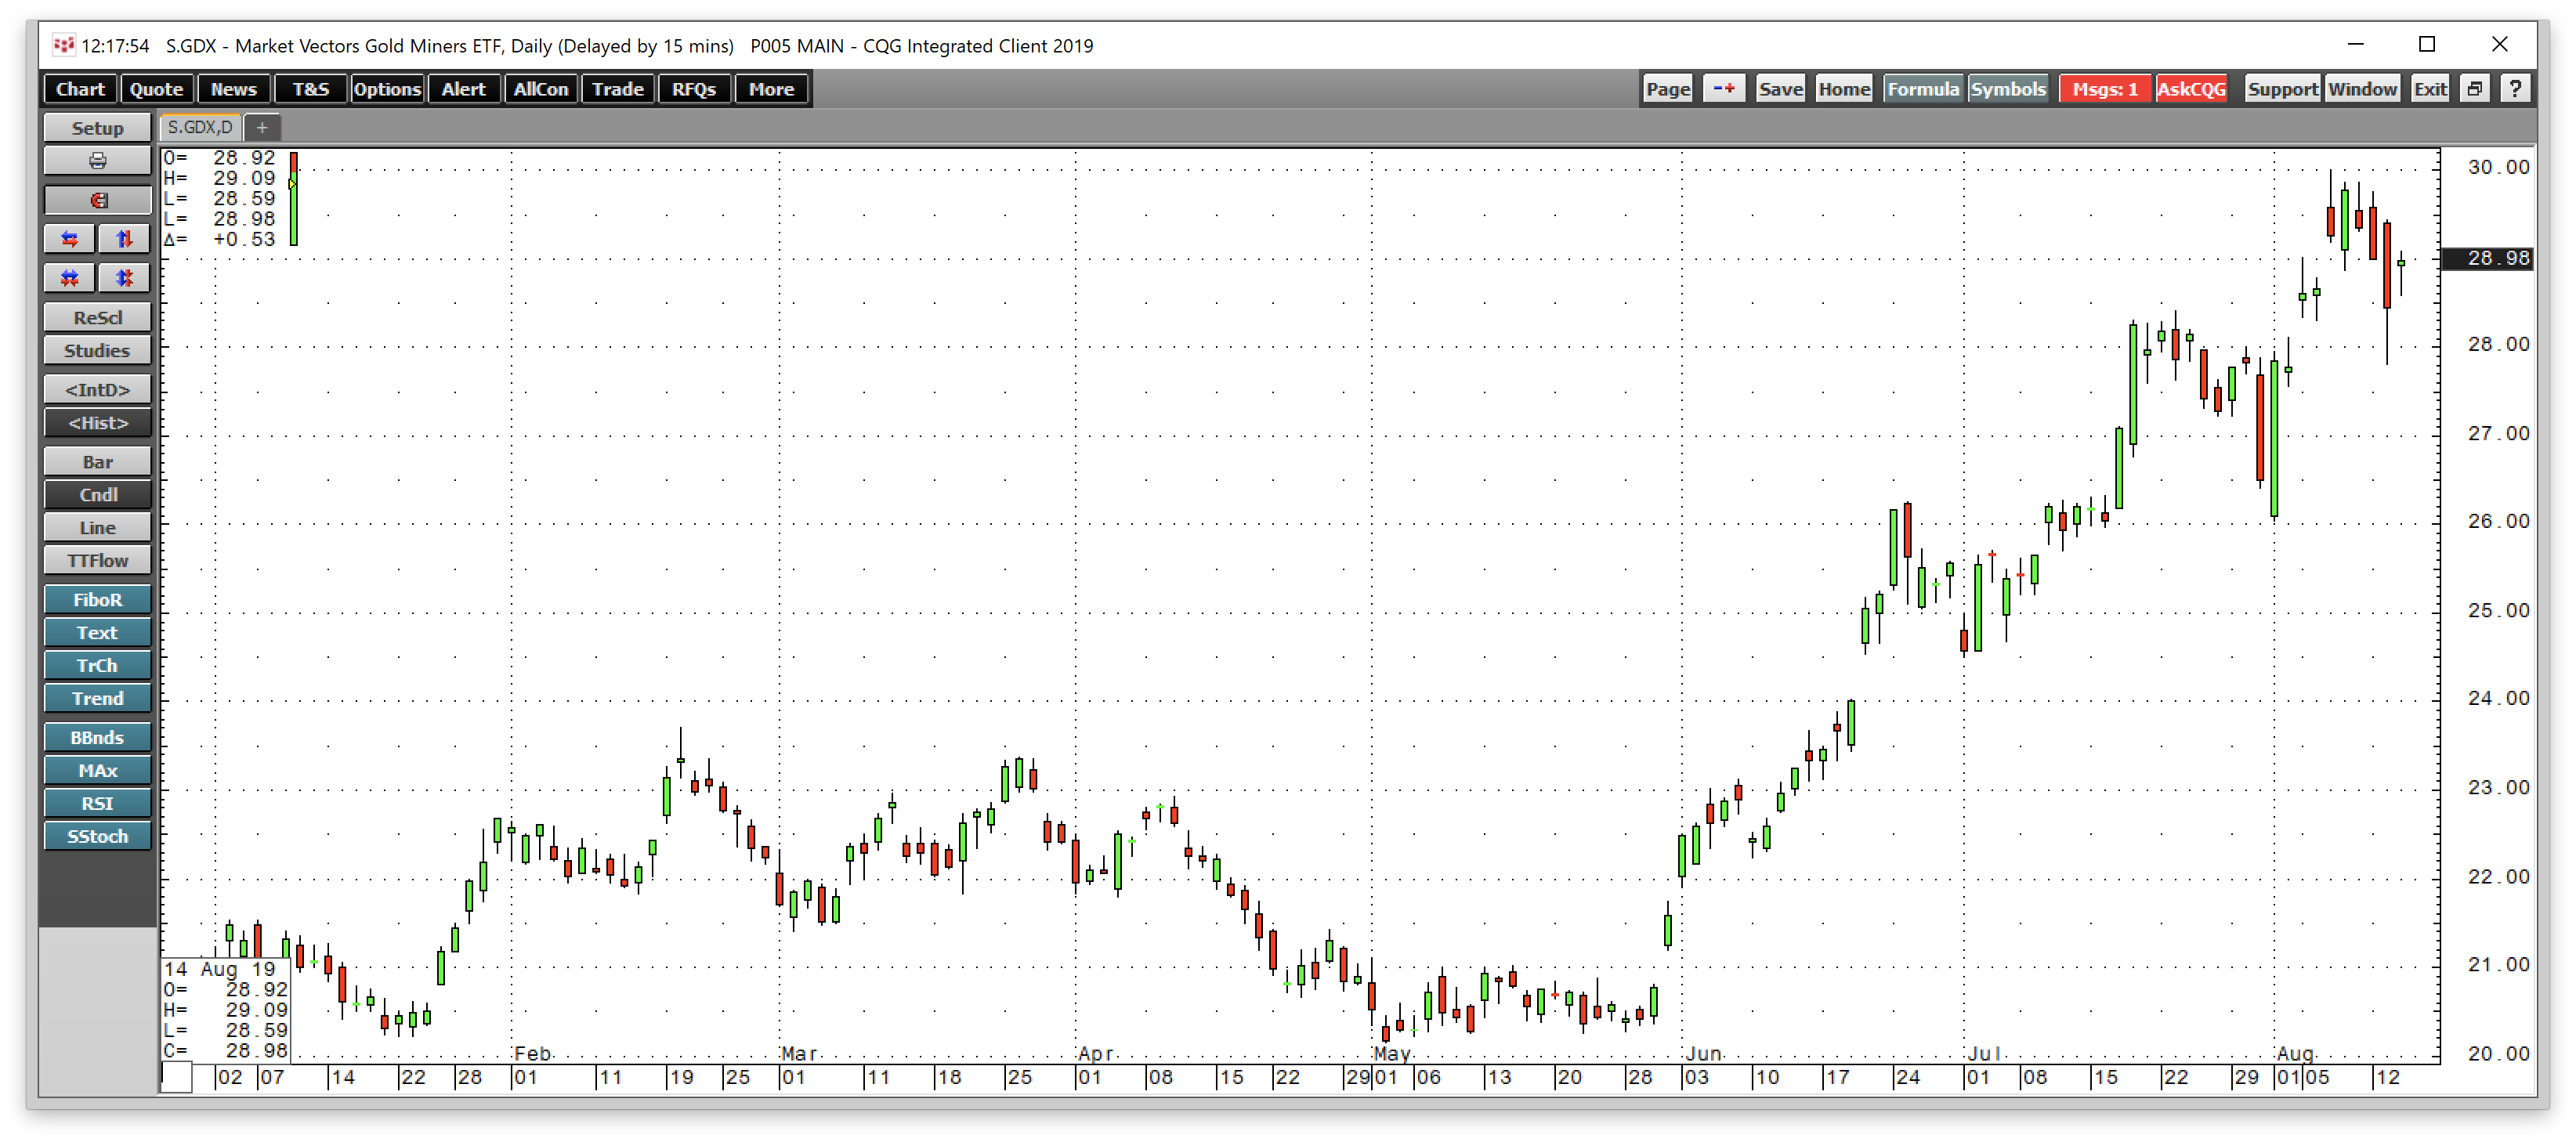
Source: CQG
Since a low at $17.28 per share in September 2018, the GDX has rallied to its most recent high at $30 per share and was at the $28.90 level on August 14. At the high, GDX had gained 73.6% as it outperformed the price action in gold over the same period.
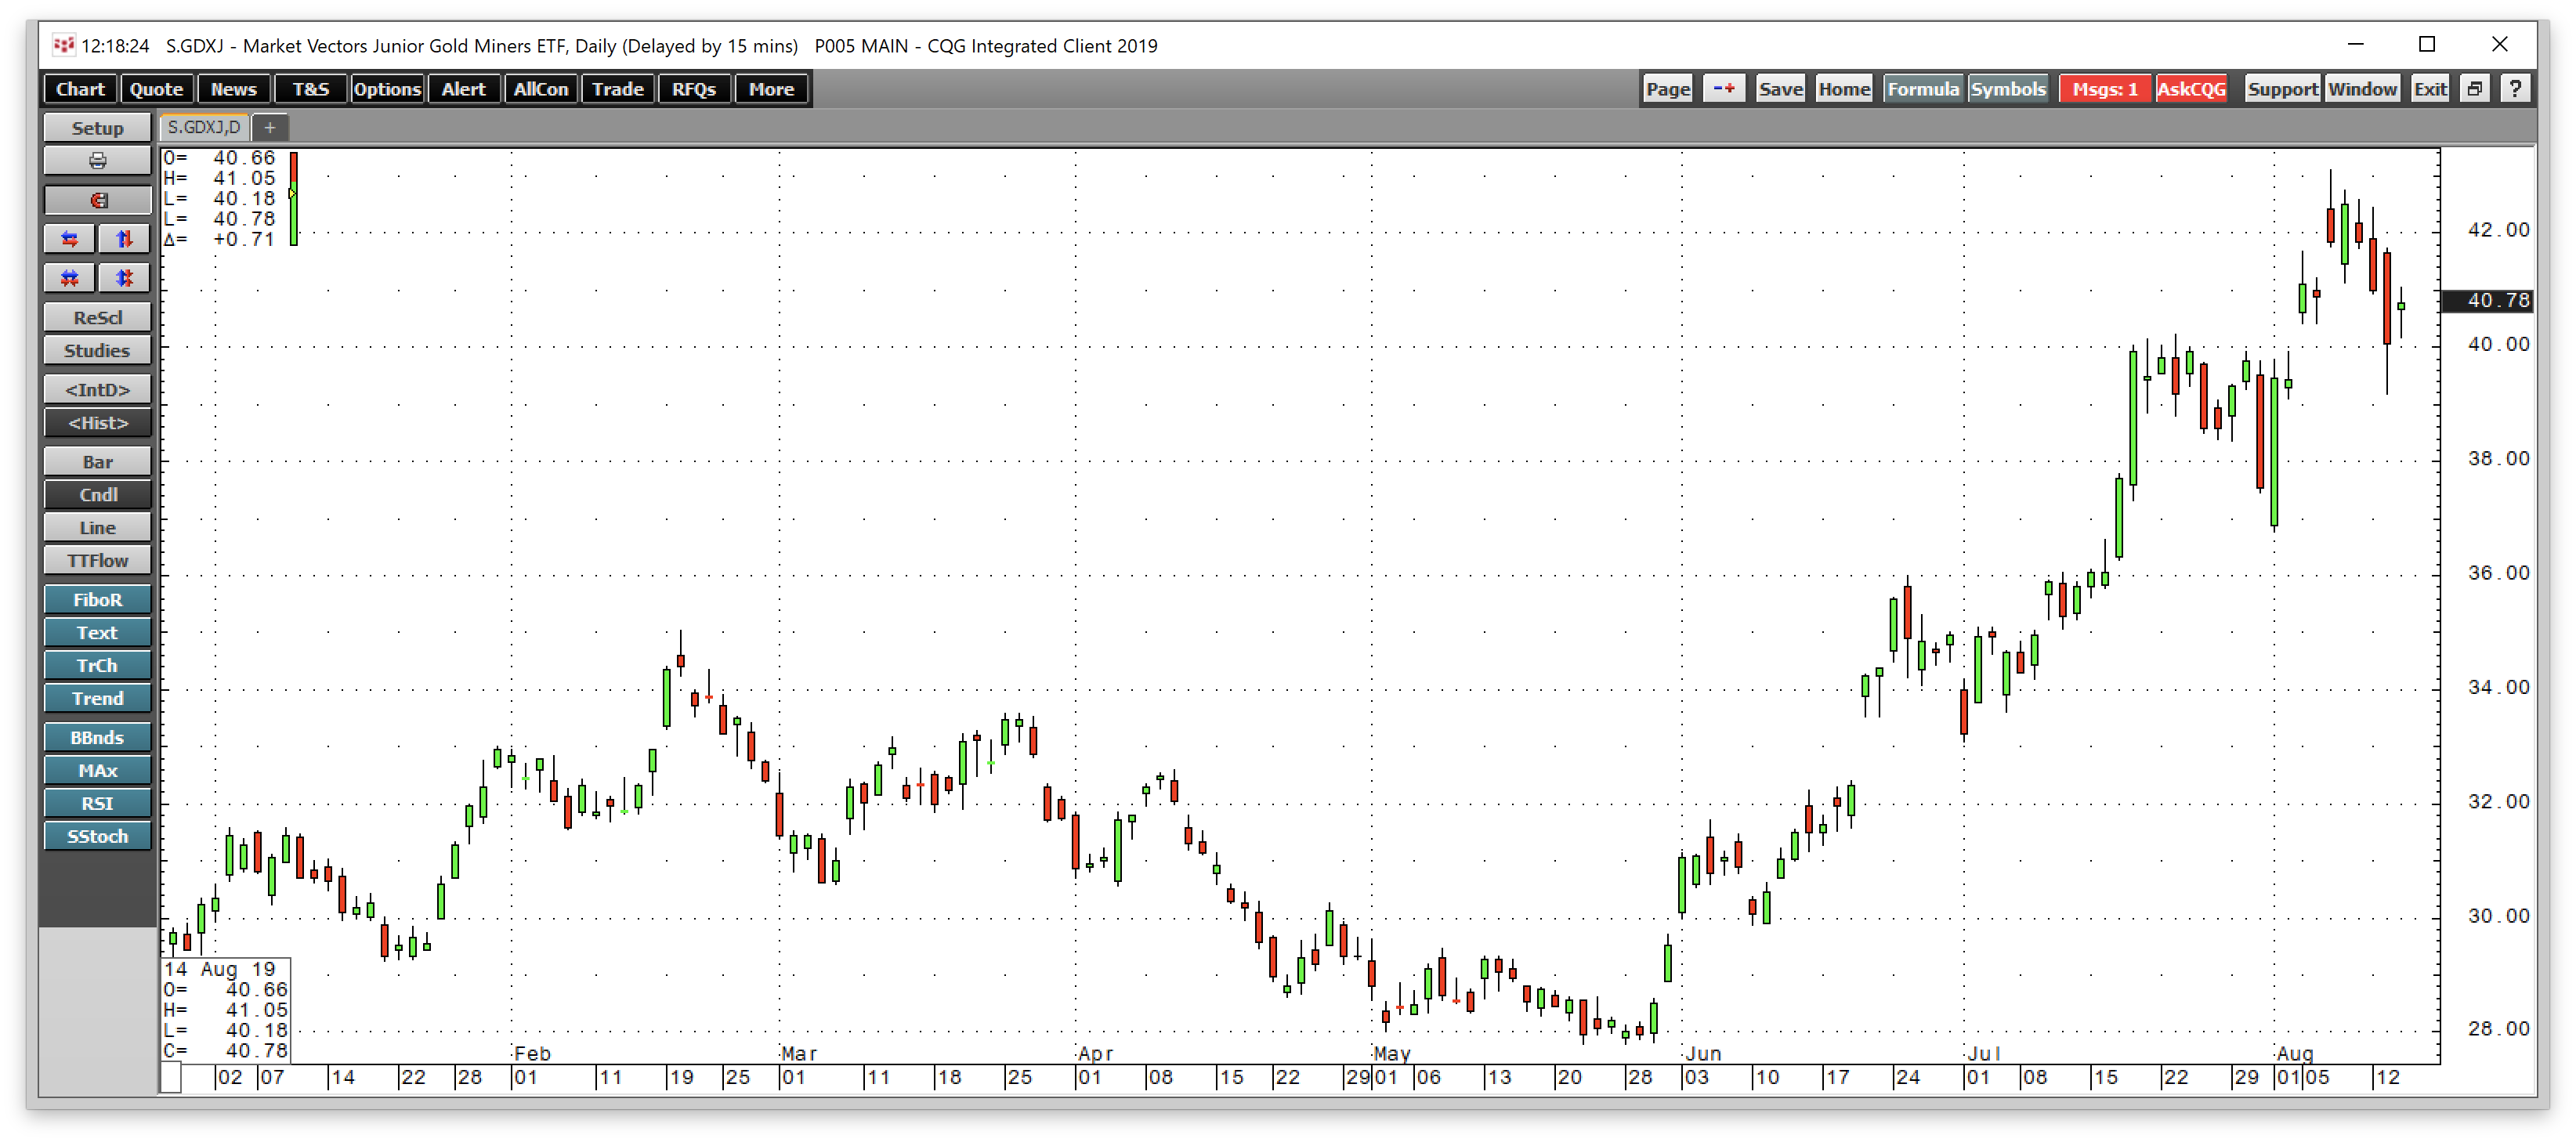
Source: CQG
GDXJ moved from $25.91 to $43.10 or 66% higher over the same period. Both of the gold mining ETF products have outperformed gold, which is another validation of the emerging bull market.
Markets rarely move in a straight line, even during the most bullish trends. The chances of a substantial correction will continue to rise with the price of the yellow metal. However, with the critical technical support level at $1377.50 now fading in the market's rearview mirror, the path of least resistance is higher, and we could be heading for a test of the 2011 peak at $1920.70 per ounce. If gold is going to continue to vault higher, the Velocity Shares 3X Long Gold ETN will act as gold on steroids when it comes to percentage gains. The fund summary for the product states:
The investment seeks to replicate, net of expenses, three times the S&P GSCI Gold index ER. The index comprises futures contracts on a single commodity. The fluctuations in the values of it are intended generally to correlate with changes in the price of gold in global markets.
UGLD has net assets of $153.31 million and trades an average of 148,360 shares each day. UGLD charges an expense ratio of 1.35%, and recently daily volume has exceeded the average.
December gold futures rallied from $1412.10 on August 1 to a high at $1531.50 on August 12, a move of 8.5%.
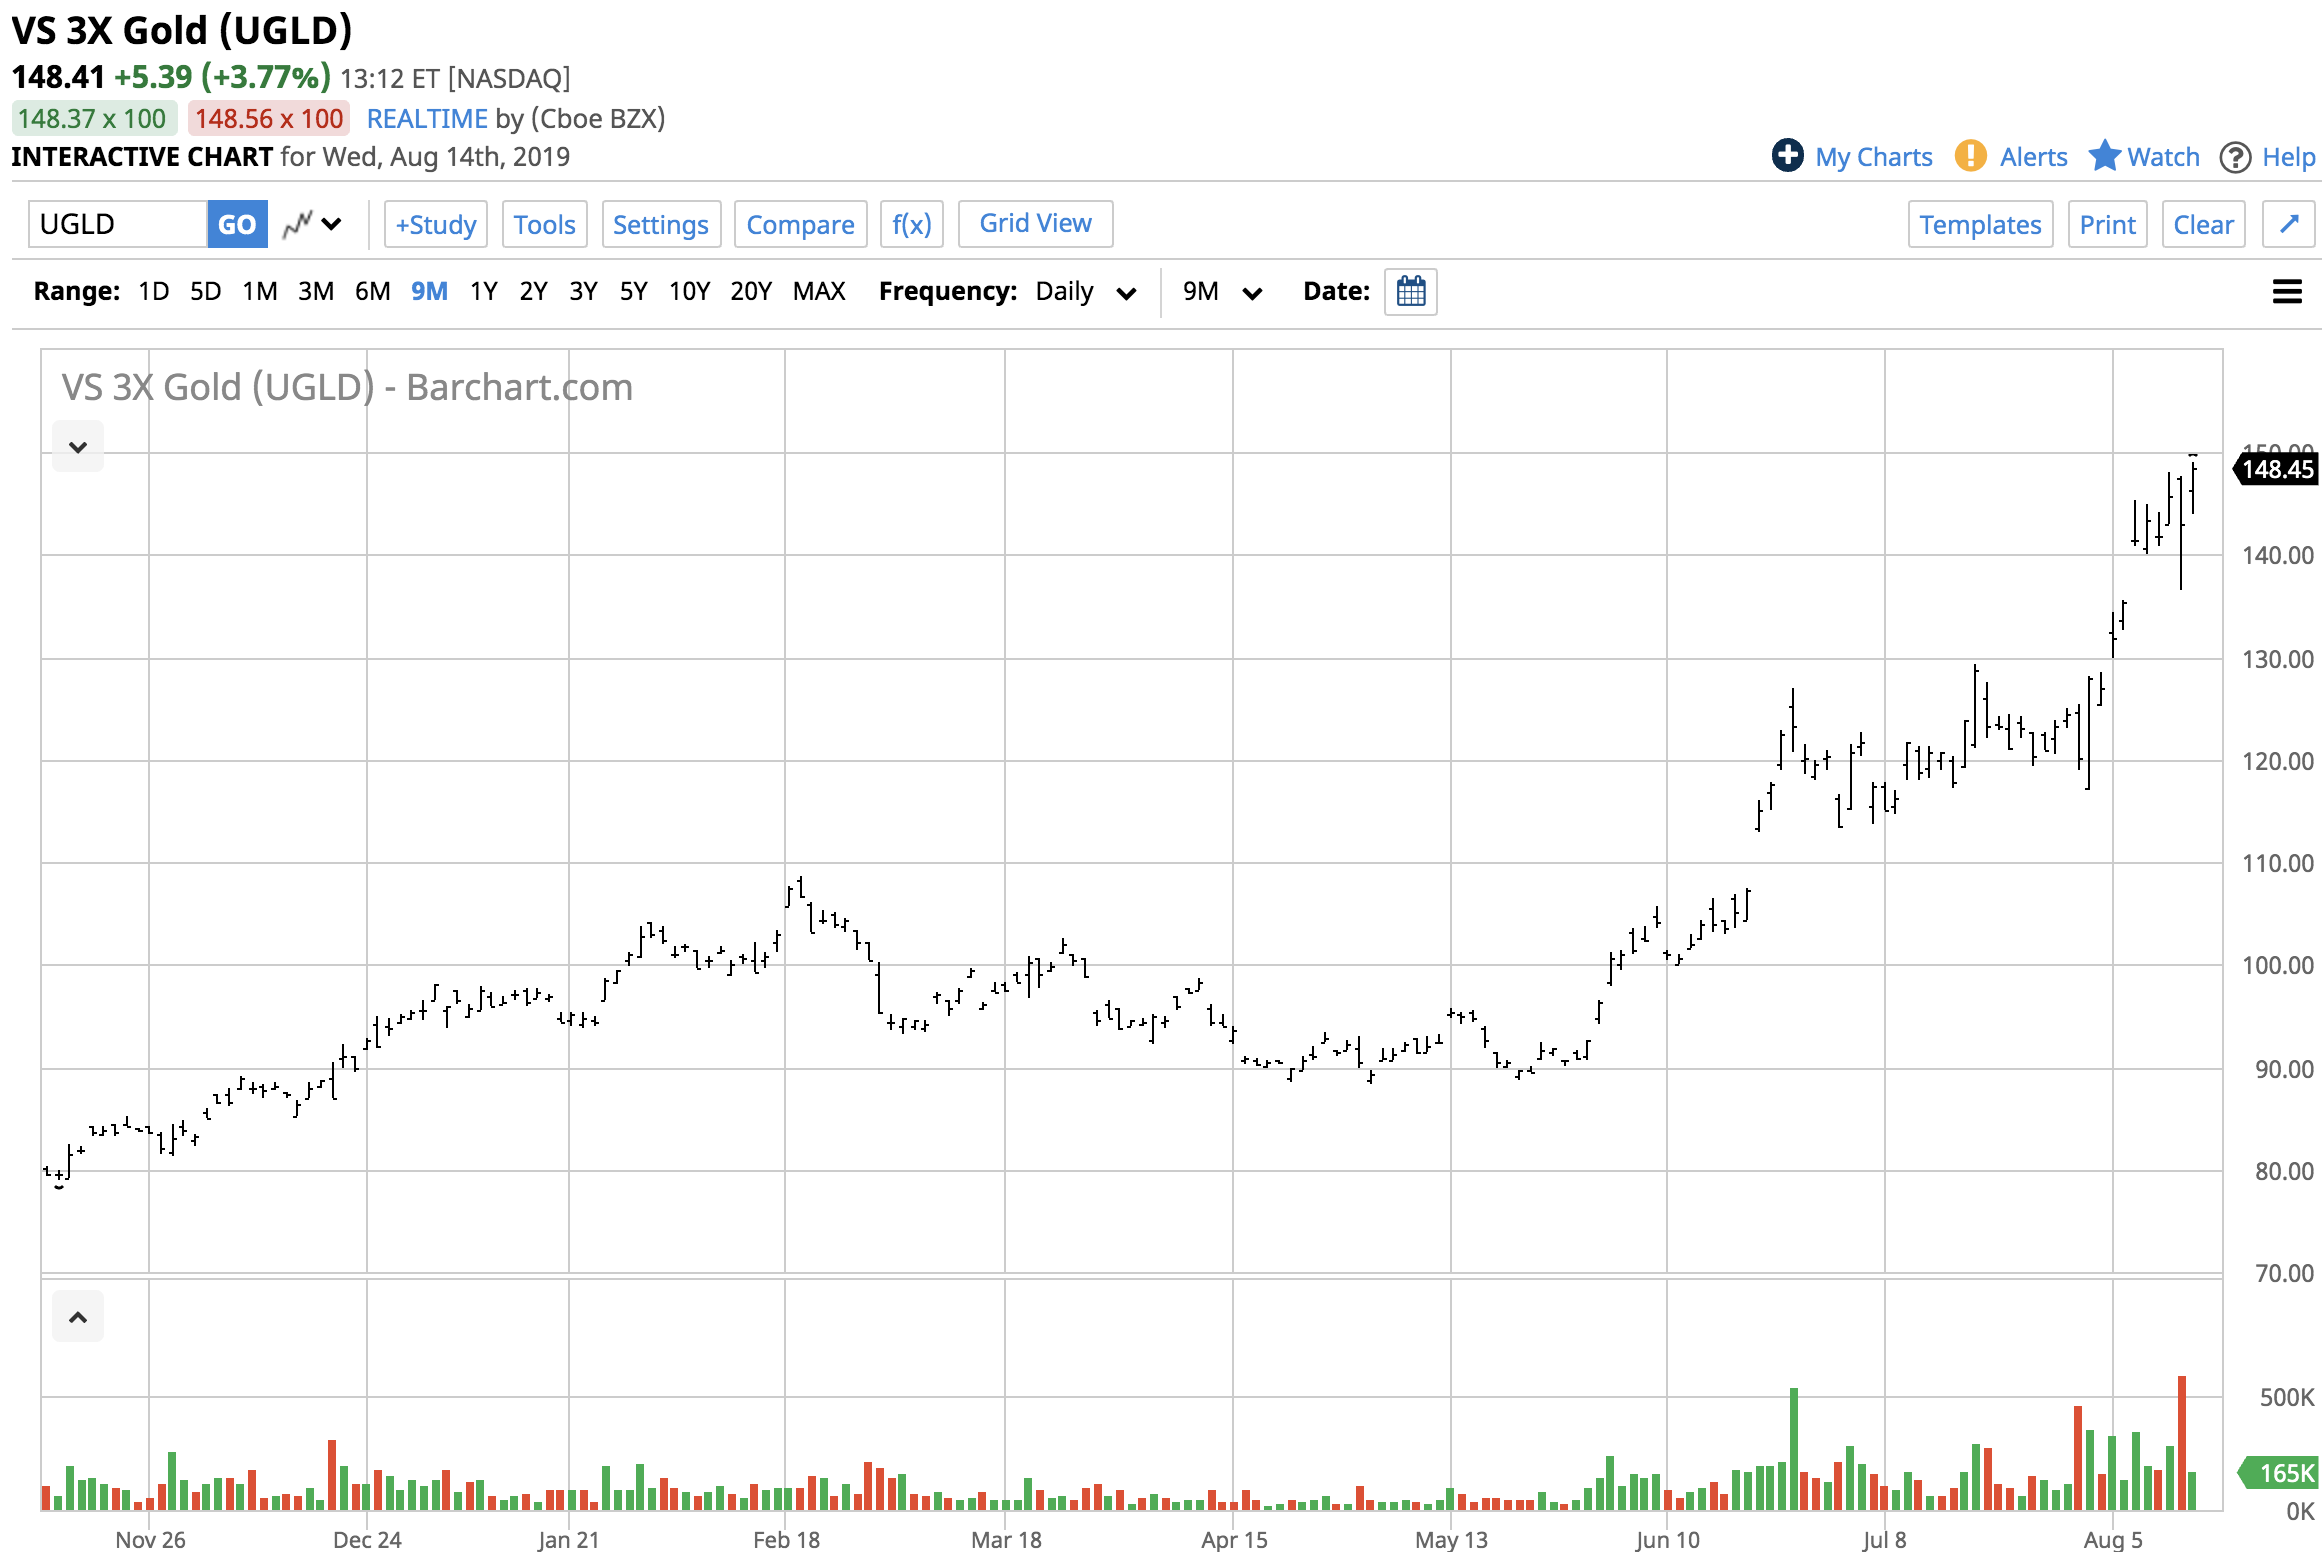
Source: Barchart
Over the same period, UGLD shares appreciated from $117.02 to $149.00 or 27.3%, slightly more than triple the percentage gain in the gold futures market.
The risk with a product like UGLD is that if gold trades sideways or suffers a downside correction, the price will evaporate quickly. However, if the price continues on its current path to higher highs, UGLD will provide golden returns.
I have been trading gold since the early 1980s, and the market has never looked this bullish to me from both fundamental and technical perspectives. The technical pictures are telling me that the herd will continue to buy gold, and the price is heading much higher over the coming days, weeks, and perhaps months.
The Hecht Commodity Report is one of the most comprehensive commodities reports available today from the #2 ranked author in both commodities and precious metals. My weekly report covers the market movements of 20 different commodities and provides bullish, bearish and neutral calls; directional trading recommendations, and actionable ideas for traders. I just reworked the report to make it very actionable!
Disclosure: I/we have no positions in any stocks mentioned, and no plans to initiate any positions within the next 72 hours. I wrote this article myself, and it expresses my own opinions. I am not receiving compensation for it (other than from Seeking Alpha). I have no business relationship with any company whose stock is mentioned in this article.
Additional disclosure: The author always has positions in commodities markets in futures, options, ETF/ETN products, and commodity equities. These long and short positions tend to change on an intraday basis.The author is long gold
Follow Andrew Hecht and get email alerts