THE Week. THE Record. THE Extreme Sign for Gold / Commodities / Gold and Silver 2018

 Tosay that gold’s weekly volume was big is like to say that snails are not thefastest animal. You can't say that it’s a lie, but it doesn't really convey theentire truth, either. Gold’s weekly volume was highest EVER. Yes, ever. Therewas not a single week – not ever during the 2011 top or when gold declined in2008 – when gold moved on volume that was higher than what we saw last week.
Isthis significant? You bet! The chart below provides details (charts courtesy ofhttp://stockcharts.com).
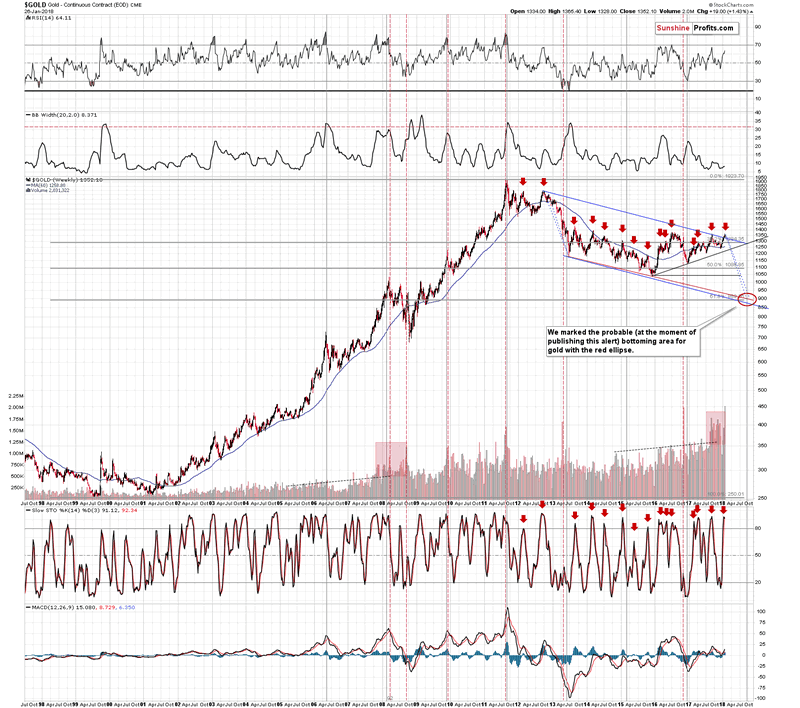
Breakingof the record is important, but it’s just an exclamation mark behind theimplications that apply based on the analogy to other huge-volume weeks.
Wemarked situations with extreme weekly volume using vertical red dashed lines.There were 2 in 2008, one in 2009, one in 2011 (THE top), one in 2013, and onein 2016. All of them were followed by declines and 5 out of 6 confirmed a majortop. The remaining case was during the 2013 decline.
Basedon the above analogy, since we are definitely not in the middle of a short-termdecline right now, it seems very likely that we are at a major top. Theabove-mentioned exclamation mark means that the top is indeed meaningful.
Whatcould be meaningful about yet another $1,350-or-so top? There were quite a fewof them in the past few years. It mightbe meaningful because that’s the top that starts the final slide in gold.That’s exactly what many other factors are pointing to, so such scenario seemsquite realistic.
Havingdiscussed the key gold chart for the key preciousmetals, let’s check what’s happening in the currency market. We explained thesituation in detail and we provided updates during the previous week, so if youhaven’t had the chance to read the last few alerts, it might be a good idea to do so today. Since we now have theweekly closing prices, it’s time for a weekly update.
The USDCrisis
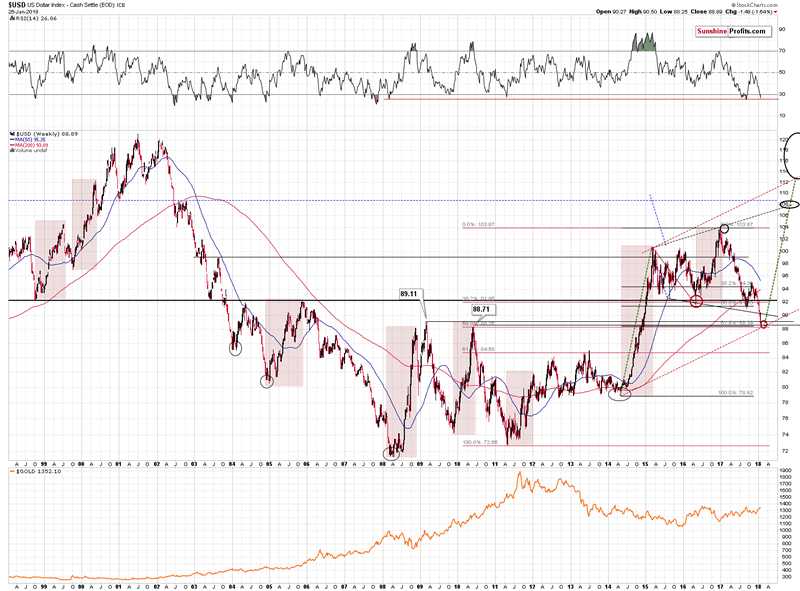
TheUSD Index closed slightly below the highest of the key support lines (2009 highof 89.11) and above 3 remaining support levels (the 2010 high of88.71, 50% Fibonacci retracement based on the 2011 – 2017 rally and the 61.8%Fibonacci retracement based on the 2014 – 2017 rally).
Theadditional detail here is that in today’s pre-market trading, the USD Index hasalready moved to 89.27, which is more above the 2009 high than Friday’s closewas below it. In other words, the tiny breakdown was already invalidated.
Whatdoes this tell us? It tells us that the USD Index is highly likely right aftera critical bottom. Even if it was just one of the very important levels thatwould be reached, the situation would already be bullish in light of the veryoversold situation in the RSI indicator. But it’s not just one extreme supportthat was reached, but 4 of them.
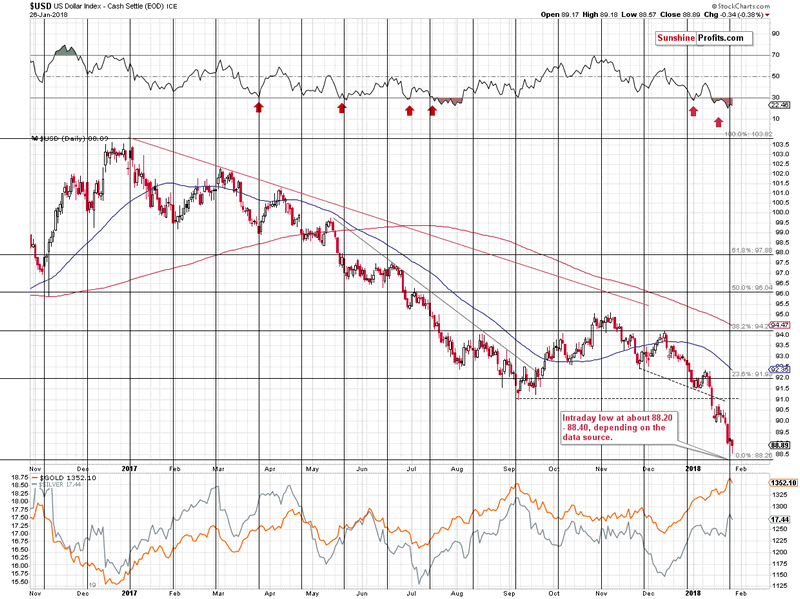
Basedon the daily RSI indicator, the USD Index was most oversold in more than a yearand it reversed exactly at theturning point. The oversold status is not yet a sign that the bottom is in, butit makes other signals – such as the ones described above – much moreimportant.
Thestrength of the bullish factors and the amount of them is almost breathtaking.
Aswe discussed earlier, it was the USD weakness that was most likely the factorbehind silver’s lack of decline. If the USD Index has just formed a majorbottom – and based on the technical reasons that’s more than likely – then wecan expect significant weakness in the price of the white metal in thefollowing weeks and months.
Yes,we realize that the fundamental picture for silver is favorable, we are awareof the arguments for the silver shortage and the case for the silver manipulation, but all of thisdoesn’t have to prevent silver from declining in the medium term. It certainlydidn’t in 2008, so even if we combine the bullish fundamentals for silver, it’stechnical picture and the situation in the USD Index, we still get the bearishoutlook for the medium term.
Let’stake a look at an additional long-term gold chart.
Gold vs.Stocks
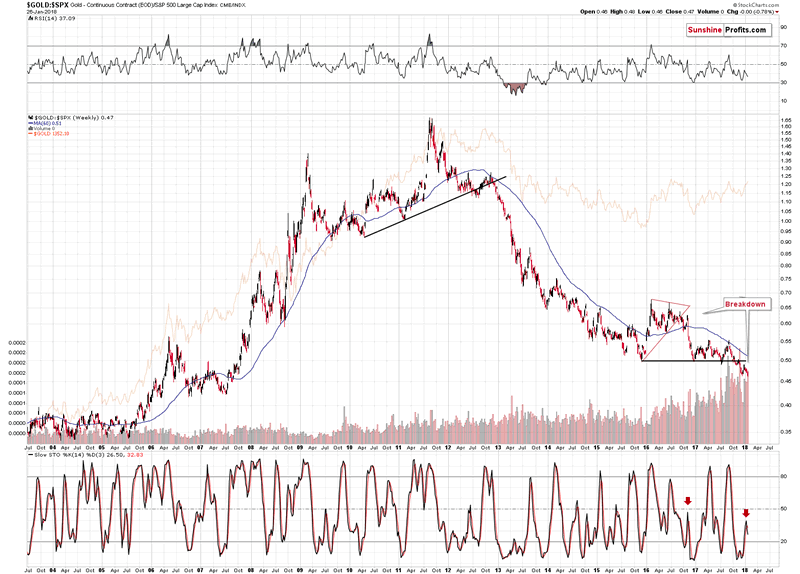
Thespecial thing about the gold to S&P ratio is that it smoothens the priceswings and makes it clear what’s really going on. In the case of the price ofgold itself, the short-term price swings are more important, and they look justlike early parts of bigger moves. In the case of the ratio, however, the smallmoves are even smaller, and the bigger ones are even bigger. It’s easier todifferentiate between them in this way.
Theflag example is the 2012 breakdown and the early 2013 decline. In the case ofgold, it still looked like a consolidation after a rally, but the ratio showedthat the rally was over. The latter turned out to be the reality.
Theratio is now after a major breakdown and after a corrective upswing thatverified it. It now resumed its decline as confirmed by the sell signal fromthe Stochastic indicator.
Thesignificance of the above is much greater than it may appear at the firstsight. The reasons are the analogies to the similar cases. The breakdown belowa major support line is very important because the only analogous case was the2012 breakdown. The one that started the huge slide in the precious metalsprices. Why is the confirmation so significant? Because we already had fakebreakdowns previously that were shortly invalidated. Not this time. This timethe implications are fully bearish and confirmed.
Speakingof the confirmation and sell signal from the Stochastic indicator – it’ssignificant, because of the similarity to the action in late 2016. Back thenthe ratio broke below the triangle pattern and rallied back up. It then toppedand continued to slide – and this slide was confirmed by the sell signal fromthe Stochastic indicator. We’re seeing the same kind of confirmation this time.Just as the price of gold followed the ratio lower, the same appears likelythis time.
Thegold to S&P 500 ratio is now breaking to new lows and this is taking placeafter the verification of the breakdown below 2015, 2016 and 2017 lows. It’stough to imagine a more bearish situation for the ratio – and thus for gold –than the above.
Beforesummarizing, we would like to remind you about the critical signal we described on Friday:
The most important thing is thatgold didn’t even manage to rally above $1,370 despite USD’s volatile declineduring yesterday’s session. In the previous alerts we thoroughly described thelikely strength of reaction in light of the possible decline in the USD andwhile gold moved in precise tune with it, yesterday, it didn’t even manage todo just that. Gold’s lack of strength was astonishing and that (along with thelevels that the USD reached) was the factor that made us strongly increase thesize of our short positions once again (they had been limited previously).
Summingup, the USD’s epic turnaround along with gold’s extraordinary weakness relativeto the USD’s intraday decline along with multiple bearish confirmations paint avery bearish picture for the precious metals market for the following weeks.The situation was very bearish for PMs based on the above, but therecord-breaking weekly volume in gold took the bearishness to a new – even moreextreme – level. Before calling us perma-bears, please note that we’reexpecting to see gold well above its 2011 high in a few years, likely more thandoubling its price. We just don’t think that the key buying opportunity isalready behind us and we want to prepare you for taking advantageof it.
If you enjoyed the above analysis and would like toreceive free follow-ups, we encourage you to sign up for our gold newsletter –it’s free and if you don’t like it, you can unsubscribe with just 2 clicks. Ifyou sign up today, you’ll also get 7 days of free access to our premium dailyGold & Silver Trading Alerts. Signup now.
Thank you.
Przemyslaw Radomski, CFA
Founder, Editor-in-chief
Toolsfor Effective Gold & Silver Investments - SunshineProfits.com
Tools für EffektivesGold- und Silber-Investment - SunshineProfits.DE
* * * * *
About Sunshine Profits
SunshineProfits enables anyone to forecast market changes with a level of accuracy thatwas once only available to closed-door institutions. It provides free trialaccess to its best investment tools (including lists of best gold stocks and best silver stocks),proprietary gold & silver indicators, buy & sell signals, weekly newsletter, and more. Seeing is believing.
Disclaimer
All essays, research and information found aboverepresent analyses and opinions of Przemyslaw Radomski, CFA and SunshineProfits' associates only. As such, it may prove wrong and be a subject tochange without notice. Opinions and analyses were based on data available toauthors of respective essays at the time of writing. Although the informationprovided above is based on careful research and sources that are believed to beaccurate, Przemyslaw Radomski, CFA and his associates do not guarantee theaccuracy or thoroughness of the data or information reported. The opinionspublished above are neither an offer nor a recommendation to purchase or sell anysecurities. Mr. Radomski is not a Registered Securities Advisor. By readingPrzemyslaw Radomski's, CFA reports you fully agree that he will not be heldresponsible or liable for any decisions you make regarding any informationprovided in these reports. Investing, trading and speculation in any financialmarkets may involve high risk of loss. Przemyslaw Radomski, CFA, SunshineProfits' employees and affiliates as well as members of their families may havea short or long position in any securities, including those mentioned in any ofthe reports or essays, and may make additional purchases and/or sales of thosesecurities without notice.
Przemyslaw Radomski Archive |
© 2005-2018 http://www.MarketOracle.co.uk - The Market Oracle is a FREE Daily Financial Markets Analysis & Forecasting online publication.