These 3 Quantitative Systems Are Bullish On Gold Right Now
Being dogmatic about gold investing doesn't make much sense; there are times to be bullish and times to be bearish on the precious metal.
Trying to time the gold market is futile, but the statistical evidence shows that quantitative systems based on trend-following tend to produce attractive returns.
Introducing 3 quantitative systems based on trend-following and relative strength in the SPDR Gold Trust.
These systems are not infallible, but backtested data shows that they perform well in the long term.
Based on these indicators, gold looks quite bullish right now.
Many investors are too dogmatic when it comes to gold investing. Both the gold bulls and the bears many times take extreme positions with excessively long time horizons. The way I see it, gold can be either a good or bad investment depending on the particular market environment.
In other words, there are times to be bullish and times to be bearish on gold. Trying to predict market movements is futile, but statistical research has proven time and again that quantitative systems based on trend-following and momentum can produce market-beating returns over long periods of time.
In that spirit, the following article will be taking a look at three different quantitative systems based on trend-following and relative strength in the SPDR Gold Trust (GLD).
These systems are not perfect or infallible, but they tend to do well over the years. Importantly, the tree quantitative systems are recommending a long position in SPDR Gold Trust right now.
Trend-Following In Gold
Trend-following is a fairly simple idea; it basically means that you only invest in an asset when the trend in prices is up. In order to evaluate if the trend is up or down, we can compare the current market price versus a moving average of prices.
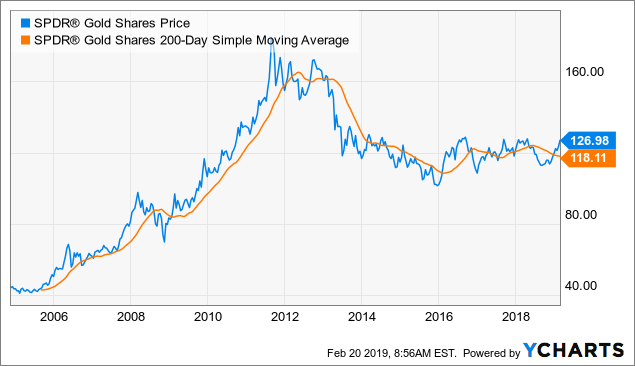
The chart below shows the evolution of the SPDR Gold Trust and its 200-day moving average since 2006. The gold-tracking ETF had a massive rally from 2006 to 2011, and it was mostly above the 200-day moving average during that period.
 Data by YCharts
After that, the ETF had a major collapse, from nearly $180 in September of 2011 to barely above $100 in November of 2015. Trend-following produced some false entry signs during that period, but those entry signs were mostly short-lived. For the most part, following the 200-day moving average would have kept investors away from the gold-tracking ETF over a multi-year period in which the precious metal produced massive losses.
The 2016-2018 period was a bad one for trend-followers in SPDR Gold Trust, since the ETF moved mostly sideways in those years, and the entry signals were ultimately disappointing.
More recently, however, the SPDR Gold Trust crossed above its 200-day moving average again in December of 2018, and it has gained over 5% since then.
These kinds of systems are obviously too simplistic to be implemented in real life, since they are based solely on one instrument and one single indicator. Besides, it's far too early to tell if this will be just a short-term move for gold or the beginning of something much bigger.
However, the fact that the 200-day moving average has been quite effective at capturing big bull and bear markets in gold over the long term deserves to be acknowledged when evaluating a position in the precious metal.
Relative Strength: Gold Vs. Stocks
Money has an opportunity cost. You don't just want to buy investments that are doing well, you really want to buy those investments that are performing better than others, because this maximizes the return on your invested capital.
Besides, relative strength says a lot about the underlying demand dynamics in an asset. It's one thing to say that gold is rising in price and a very different thing to say that gold is not only rising but also outperforming stocks.
The following system rotates between stocks and bonds by comparing SPDR Gold trust versus the SPDR S&P 500 ETF (SPY). We do this by creating a relative chart that measures the performance of the SPDR Gold Trust over the SPDR S&P 500.
When such a ratio is above its 200-day moving average, we say that gold is in an uptrend from a relative perspective, so the portfolio is allocated to the SPDR Gold Trust. Alternatively, when the ratio is in a downtrend, meaning that gold is underperforming stocks, the portfolio is allocated to the SPDR S&P 500.
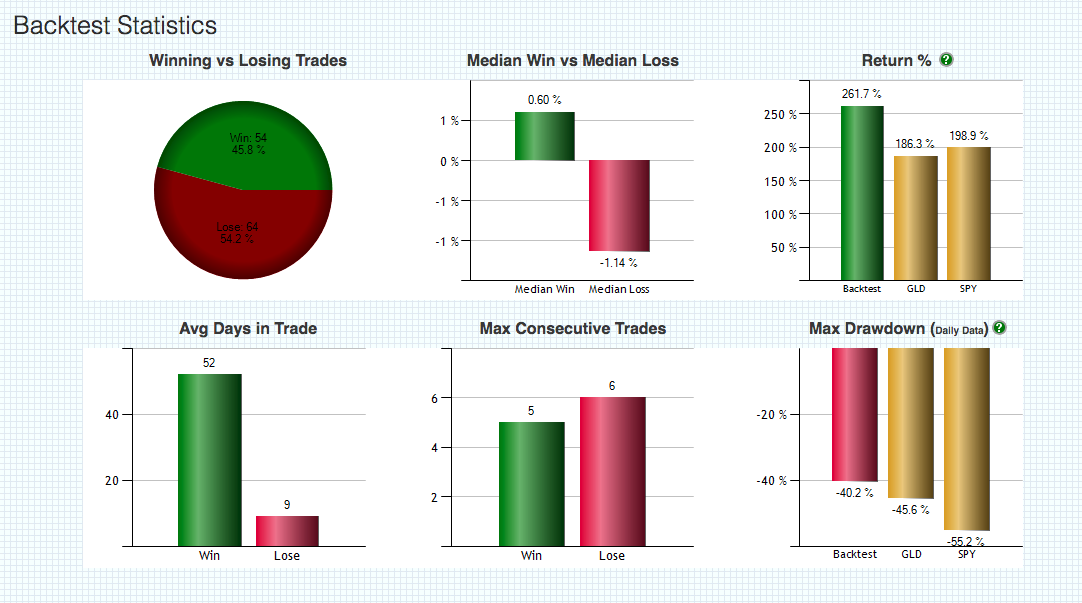
As you can see, this system widely outperformed a buy and hold strategy in both stocks and bonds over the long term. Since January of 2006, the system gained 261.7% versus 186.3% for the SPDR Gold Trust and 198.9% for the SPDR S&P 500.
The chart below shows how the relative ratio of the SPDR Gold Trust over the SPDR S&P 500 has evolved over time. Gold has been underperforming stocks since 2012, and the relative ratio is now at historically low levels. But things are changing in the past several weeks, with the relative ratio rising sharply and now being above the 200-day moving average.
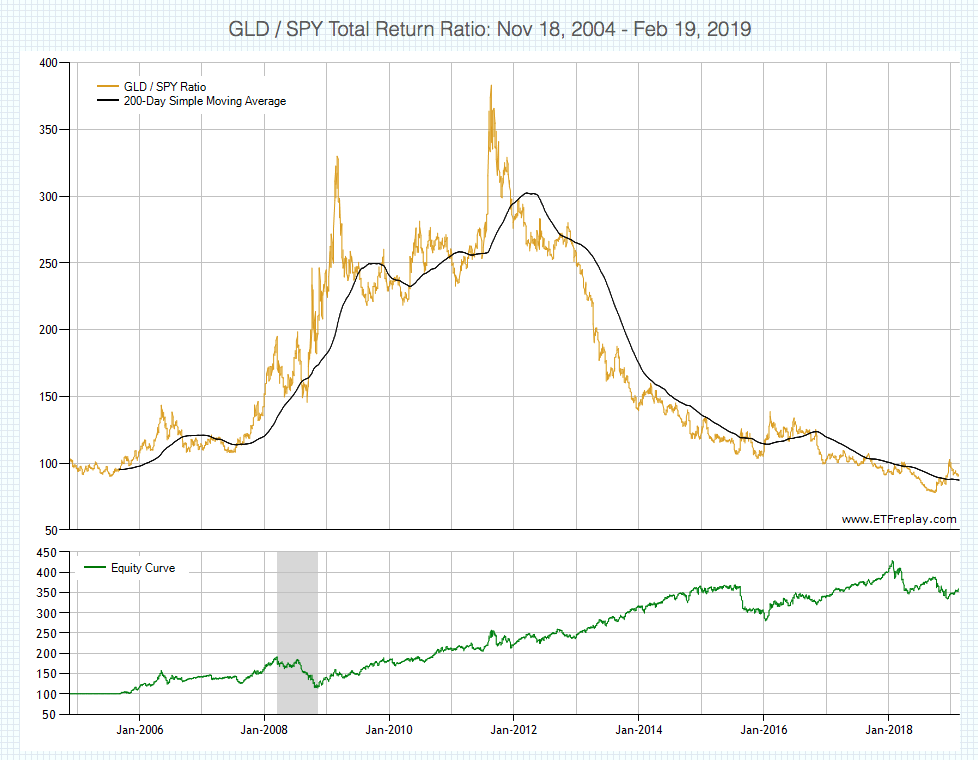 From a relative performance perspective, there are some early signs indicating that gold could be starting to recover some ground versus stocks, which is a bullish sign for the SPDR Gold Trust ETF.
There Is Always A Bull Market Somewhere
Expanding on the concept of relative strength, there is no reason to solely compare gold versus a broad stock market index. Adding more sectors and asset classes to the mix can make the performance more attractive and consistent, even if returns can also be somewhat diluted because of diversification.
The following quantitative system rotates among a universe of more than 30 ETFs representing different asset classes (stocks, bonds, and commodities) and sectors (technology, financials, etc). The main idea is buying the 3 ETFs with the strongest risk-adjusted returns over 3 and 6 months. This is done through a ranking algorithm that compares returns and volatility for the different ETFs considered.
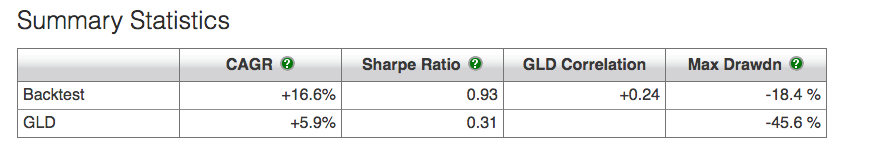
The chart below compares the backtested performance for the quantitative system versus a buy and hold investment in the SPDR Gold Trust.
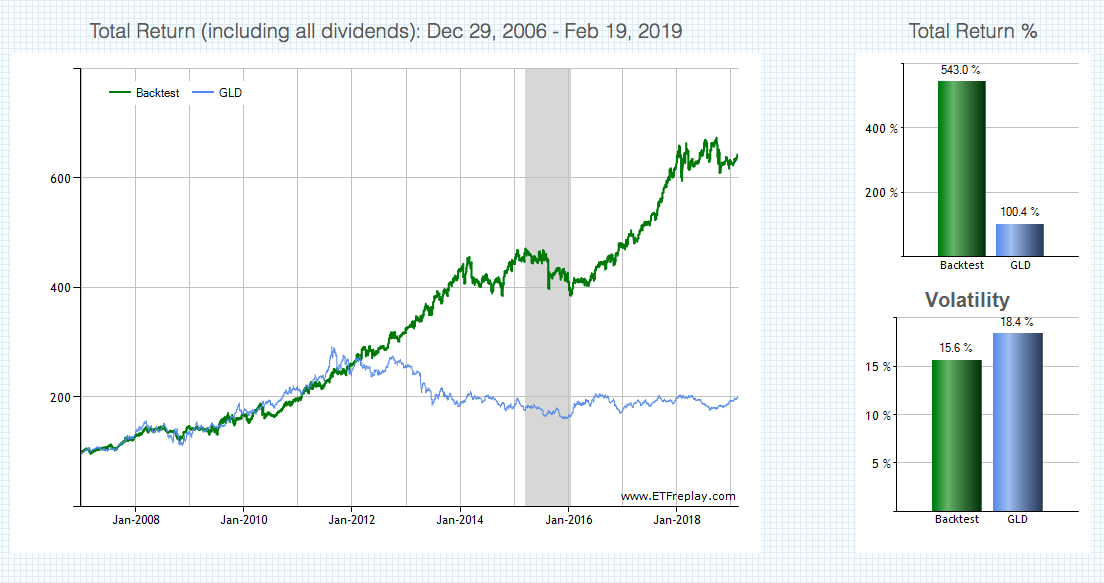 The numbers are impressive: Since 2009, the quantitative system has gained 16.6% versus a far more modest 5.9% for the SPDR Gold Trust. Even more important, the quantitative system also has a much smaller downside risk, the maximum drawdown for the quantitative system was 18.4% versus a maximum drawdown of 45.6% for the SPDR Gold Trust over the backtesting period.
 The quantitative system is updated every month for members in The Data-Driven Investor, and it has been holding the SPDR Gold Trust since November of 2018. This is clearly indicating that gold is not only outperforming stocks as a broad asset class, but also other asset classes and specific sectors in the middle term.
It's important to acknowledge that these kinds of quantitative systems are not perfect or infallible, far from that. The systems are based on trend-following, momentum, and relative strength. This means that they should be expected to produce attractive performance in times when there are well-defined and durable trends in different assets.
On the other hand, when markets are moving sideways and trends are short-lived, a quantitative system such as this one should be expected to materially underperform versus buy and hold. That's just the way these things work, no strategy can be expected to deliver market-beating returns in every time frame and in all kinds of environments.
Nevertheless, the data shows that investing in gold based on trend-following can produce attractive returns over time, and the quantitative indicators for SPDR Gold Trust look quite bullish as of the time of this writing.
Statistical research has proven that stocks and ETFs showing certain quantitative attributes tend to outperform the market over the long term. A subscription to The Data-Driven Investor provides you access to profitable screeners and live portfolios based on these effective and time-proven return drivers. Forget about opinions and speculation, investing decisions based on cold-hard quantitative data can provide you superior returns with lower risk. Click here to get your free trial now
Disclosure: I/we have no positions in any stocks mentioned, and no plans to initiate any positions within the next 72 hours. I wrote this article myself, and it expresses my own opinions. I am not receiving compensation for it (other than from Seeking Alpha). I have no business relationship with any company whose stock is mentioned in this article.
Follow Andres Cardenal, CFA and get email alerts