Today's daily charts for Gold, Silver and WTI
Gold Daily
Gold prices are coiling above October’s high.
The trend remains firmly bullish within an ascending channel.
A break above 1250.63 confirms a bullish breakout, a counter-trend break of 1241.11 warns of a deeper correction.
Silver Daily
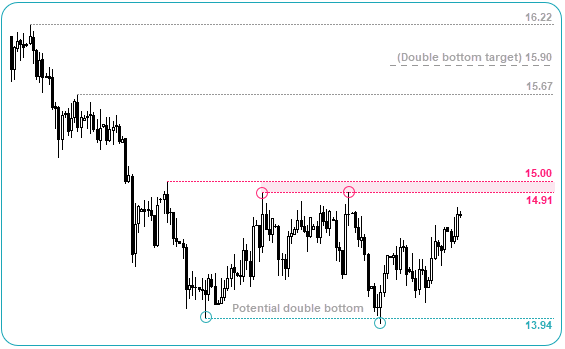
Silver remains in a sideways range, but a clear break above 14.91- 15.00 confirms a double bottom.
Range trading strategies are preferred between the 13.94 – 15.00 area.
Look for reversal patterns near support and resistance, as they have been a prominent feature of this range.
WTI Daily
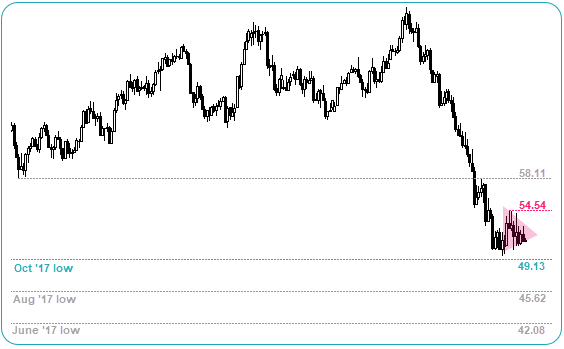
Crude oil is coiling to suggest a volatile move is pending.
With the trend clearly bearish, a break of 49.13 brings 45.62 and 42.08 lows into focus.
However, the lack of near term mean reversion would mean a counter-trend break above of 54.45 would see likely see a move to the 58.11.
This research is for informational purposes and should not be construed as personal advice. Trading any financial market involves risk. Trading on leverage involves risk of losses greater than deposits.


-636802896432111993.png)