Translating the Gold Index Signal into Gold Target / Commodities / Gold & Silver 2020

Last week, we wrote that gold miners flashed an“extremely overbought” signal, which they had only flashed once in the past –almost right at the 2016 top. The GoldMiners Bullish Percent Index recently moved to the highest levelthat it could reach – 100.
The only other case when the index was at 100, wasin mid-2016.
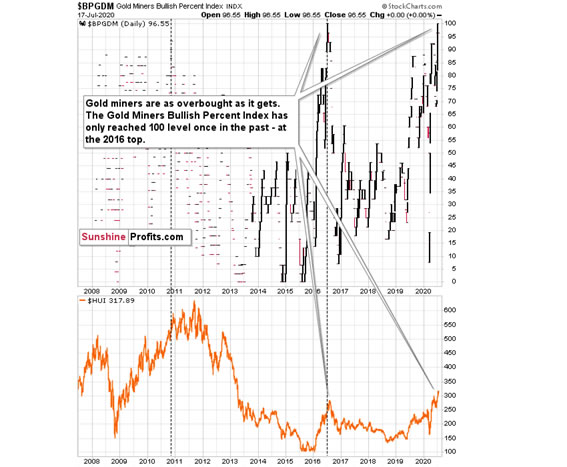
We marked this situation with a vertical dashedline. Did miners continue to move higher for a long time, or did they move muchhigher? No.
Precisely, the index reached 100 on July 1st 2016,and goldmining stocks moved higher for two additional trading days.Then they topped. This was not the final top, but the second top took minersonly about 5% above the initial July high.
This year, the index reached the 100 level on July2nd - almost exactly 4 years later, and once again practicallyexactly in the middle of the year. Miners seemed to have formed the intradayhigh on July 9th – four trading days later.
It's not justified to assume that the delay in the exacttop would be 100% identical, but it seems justified to view it as similar.Two-day delay then, and four-day delay now seem quite in tune, and thissimilarity supports a bearish predictionfor gold.
There's also one additional point that we wouldlike to emphasize and it's the previous high that the index made on November 9,2010. That was the intraday top, so there was no additional delay. There wasone additional high about a month later, in December, but miners moved onlyabout 1.5% above the initial high then.
One might ask if mining stocks are reallyoverbought right now given the unprecedented quantitativeeasing, and the answer is yes. Please note that in 2016 the worldwas also after three rounds of QE, which was also unprecedented, and it didn'tprevent the miners to slide after becoming extremely overbought (with the indexat the 100 level). The 100 level in the index reflects the excessive optimism,and markets will move from being extremely overbought to extremely oversold andvice versa regardless of how many QEs there are. People tend to go from theextreme fear to extreme greed and then the other way around, and no fundamental piece of news will change that in general. The economic circumstances change,but fear and greed remain embedded in human (and thus markets') behavior.Taking advantage of this cyclicality is the basis for most (if not all) gold tradingtips and the same goes for other markets.
Today, we would like to dig deeper into the analogyto the 2016 top. There are more similarities than just the most-extreme readingfrom the Gold Miners Bullish Percent Index.
In order to do that, let’s zoom in.
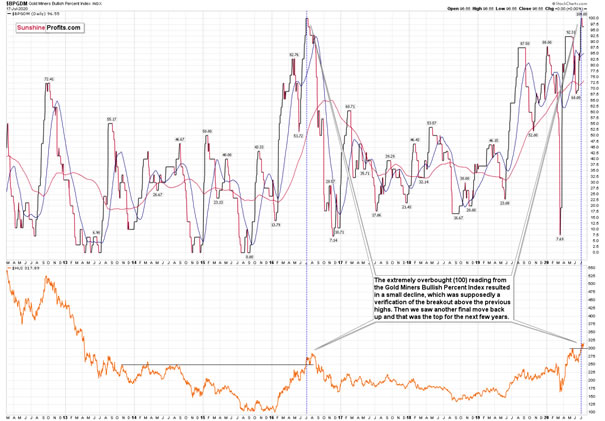
Back in 2016, the extremely overbought (100)reading from the Gold Miners Bullish Percent Index resulted in a small decline,which was supposedly a verification of the breakout above the previous (2013and 2014) highs. Then we saw another final move back up and that was the topfor the next few years.
What happened recently? The extremely overboughtreading resulted in a decline back to the previous 2020 high and then anothermove higher. This is very similar to what we saw in 2016.
What happened in the GDX ETF with regard to its owntechnical indications?
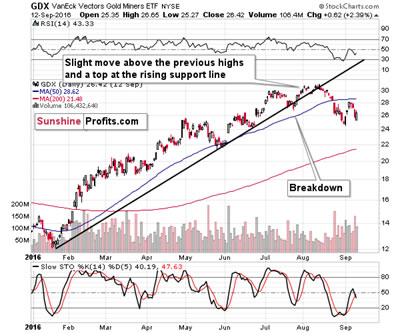
Well, shortly after the extremely-overboughtreading, the GDX ETF moved lower and broke below the rising medium-term supportline. It then moved back up and topped slightly above the previous highs. Whenthe rising support line was more or less at the same price level as theprevious high, GDX broke below it and formed a top that was not exceeded for afew years.
And what happened recently in the GDX?
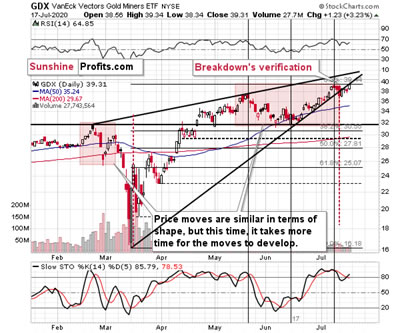
Pretty much the same thing. Shortly after we sawthe extreme (100) reading from the Gold Miners Bullish Percent Index, GDX brokebelow its rising medium-term support line. It then moved back up, and while itdidn’t move to new intraday highs, Friday’s closing price was slightly abovethe previous 2020 high.
The rising medium-term support line just moved tothe previous high as well.
The history has been repeating to a veryconsiderable (quite remarkable) extent, and if it continues to do so – whichseems likely – we’re likely to see a sizable decline shortly. In fact, Friday’shigh might have been the high for the next few months. If not, then sucha high is very likely to form this week.
Thank you for readingtoday’s free analysis. Please note that it’s just a small fraction of today’sfull Gold & Silver Trading Alert. The latter includes multiple details suchas the interim target for gold that could be reached in the next fewweeks.
If you’d like to read those premium details, wehave good news. As soon as you sign up for our free gold newsletter, you’ll get7 access of no-obligation trial of our premium Gold & Silver TradingAlerts. It’s really free – sign up today.
Thank you.
Przemyslaw Radomski, CFA
Founder, Editor-in-chief
Toolsfor Effective Gold & Silver Investments - SunshineProfits.com
Tools für EffektivesGold- und Silber-Investment - SunshineProfits.DE
* * * * *
About Sunshine Profits
SunshineProfits enables anyone to forecast market changes with a level of accuracy thatwas once only available to closed-door institutions. It provides free trialaccess to its best investment tools (including lists of best gold stocks and best silver stocks),proprietary gold & silver indicators, buy & sell signals, weekly newsletter, and more. Seeing is believing.
Disclaimer
All essays, research and information found aboverepresent analyses and opinions of Przemyslaw Radomski, CFA and SunshineProfits' associates only. As such, it may prove wrong and be a subject tochange without notice. Opinions and analyses were based on data available toauthors of respective essays at the time of writing. Although the informationprovided above is based on careful research and sources that are believed to beaccurate, Przemyslaw Radomski, CFA and his associates do not guarantee theaccuracy or thoroughness of the data or information reported. The opinionspublished above are neither an offer nor a recommendation to purchase or sell anysecurities. Mr. Radomski is not a Registered Securities Advisor. By readingPrzemyslaw Radomski's, CFA reports you fully agree that he will not be heldresponsible or liable for any decisions you make regarding any informationprovided in these reports. Investing, trading and speculation in any financialmarkets may involve high risk of loss. Przemyslaw Radomski, CFA, SunshineProfits' employees and affiliates as well as members of their families may havea short or long position in any securities, including those mentioned in any ofthe reports or essays, and may make additional purchases and/or sales of thosesecurities without notice.
Przemyslaw Radomski Archive |
© 2005-2019 http://www.MarketOracle.co.uk - The Market Oracle is a FREE Daily Financial Markets Analysis & Forecasting online publication.