Two Factors for Gold That You Don't Want to Miss / Commodities / Gold and Silver 2018

 Eventhough mining stocks closed last week below the Jan. 2 close and silver evendeclined below the Dec 31, 2017 close, gold moved higher. It’s not far fromthis year’s top either. So, is all well and are bullish goldprice forecasts justified? Not necessarily. In today’s article, weshow you two reasons why it’s a good idea to think twice before opening longpositions in gold.
Sometime ago we discussed the apex technique for the HUI Index and it workedperfectly, triggering a reversal right at the apex of the triangle. Today, wecan see something very similar on the long-term GDX ETF chart and in light ofthe mentioned performance, it shouldn’t be ignored. Let’s take a look at thedetails (charts courtesy of http://stockcharts.com).
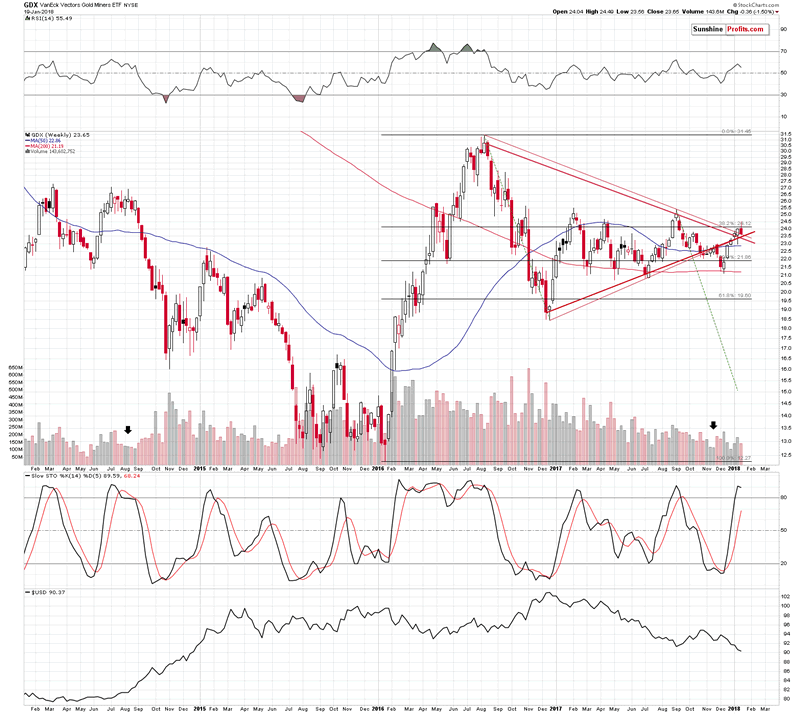
Ifyou’re not familiar with the apex reversal technique, here’s a quick intro.Whenever we have a visible triangle pattern, the moment when the lines creatingthe triangle cross marks the likely time target for a turnaround. This is amethod for detecting reversals, but it doesn’t say anything about the price, atwhich the reversal is likely. This technique doesn’t work for all markets, but- fortunately for us – it’s quite efficient in the case of the precious metalsmarket.
Thetriangle pattern is clearly visible as it’s based on the very important 2016and 2017 price extremes. We created two triangles, one based on the closingprices and the other based on the intraday extremes. Based on the former, thereversal was likely to be seen last week or the week prior to it, and based onthe latter, the reversal was likely to be seen last week or this week. Thecommon denominator is the last week, and – unsurprisingly – mining stocksreversed precisely at the moment.
Theimplications of the turnaround in mining stocks is clearly bearish as thepreceding move was up.
What about the gold price itself?
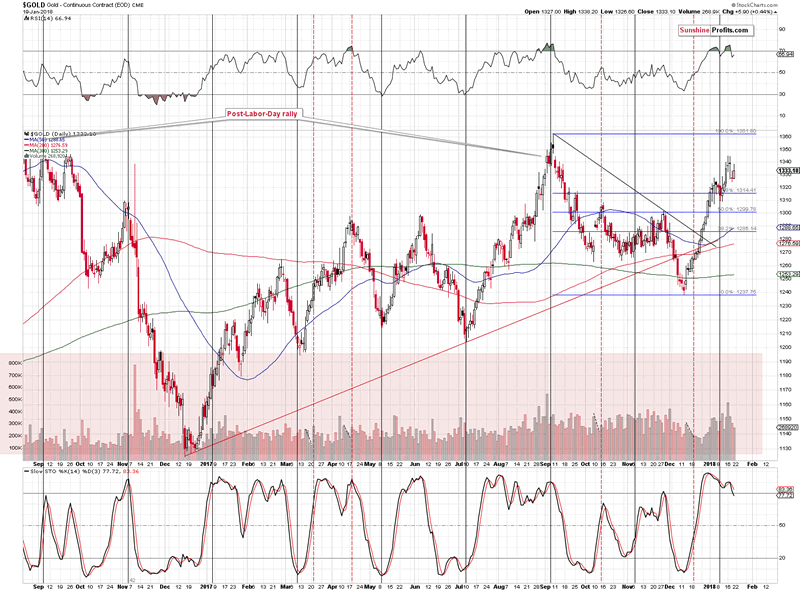
OnFriday, the yellow metal moved a few dollars higher on relatively low volume(lowest in a week). The sell signals from the RSI and Stochastic remain inplace. However, the overall picture is much more bearish than it may seem basedon these three signals alone.
Oneof the very important additional factors is gold’s strength relative to the USDIndex. To be more precise – the lack thereof.
TheUSD Index declined by 0.36 last week. What did gold do in light of the above?How much it rallied? Not at all. Gold moved $1.80 lower (and GLD was down by$0.54, so gold futures’ price data is not accidental or a data error). Whilewe’re at it – silver declined by 11 cents. Goldstocks (HUI) were down by 4.41, while silverstocks (SIL) were down by $0.68 (over 2%). By the way, the S&P 500 was up almost1%, so silver and miners had another reason to rally.
Arefusal to rally, when a given market should move higher is a clear sign of atop. In the case of the precious metals market we get an additionalconfirmation by looking at gold stocks’ performance relative to gold’sperformance. A decline of over 4 index points in light of less than a $2decline in gold is definitely as sign of underperformance of the former.Another bearish confirmation.
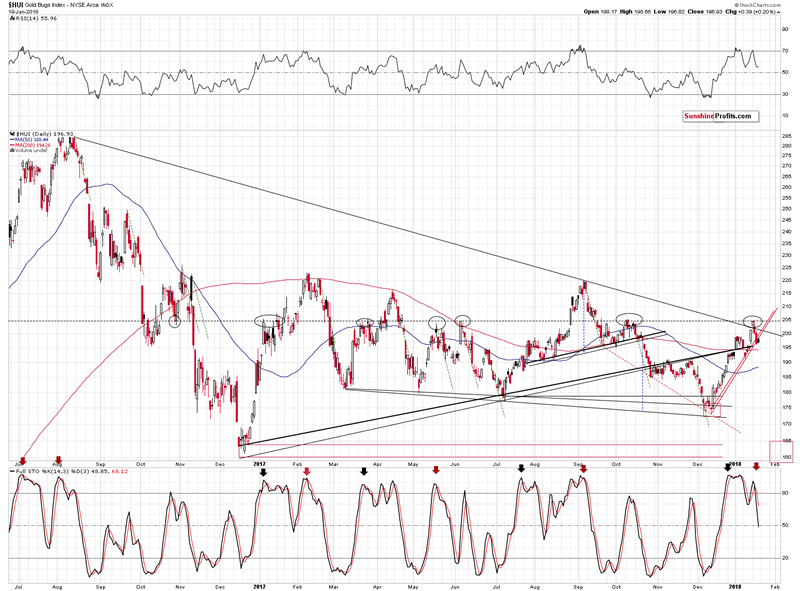
Goldstocks themselves (HUIIndex)are after an invalidation of a medium-term breakout, and a breakdown below thevery short-term rising support line. No matter if you base the latter on theintraday lows or the closing prices, the breakdown just took place. The latteris not confirmed, but if we consider the fact that gold actually moved a bithigher on Friday, we see that miners broke lower even while they had goodreason not to. That’s a bearish indication.
Thesell signal from the Stochastic indicator suggests lower prices as well.
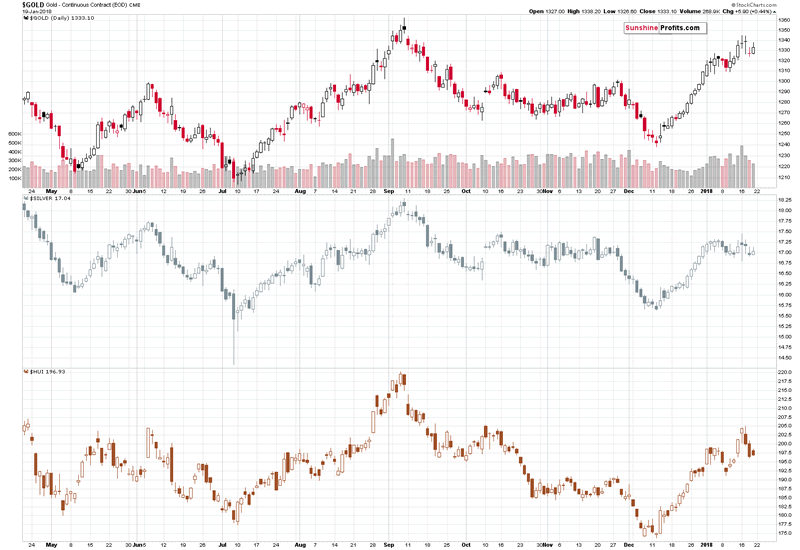
Let’stake a look at silver.
In Friday’sGold & Silver Trading Alert, we wrote the following:
Silver closed yesterday’s sessionnot only below the January 2nd close, but also below the December 31st,2017 close. In other words, 2018 is a down year for silver, even consideringthe current price of $17.07.
This is particularly shockinggiven the very strong performance of the general stock market, with which silveris traditionally more correlated than gold. Silver simply does not want to movehigher and this is based on more than just a day or two – this has been thecase for weeks.
Silverclosed the week below the Dec 31st 2017 close, further confirmingthat this is a down year for silver.
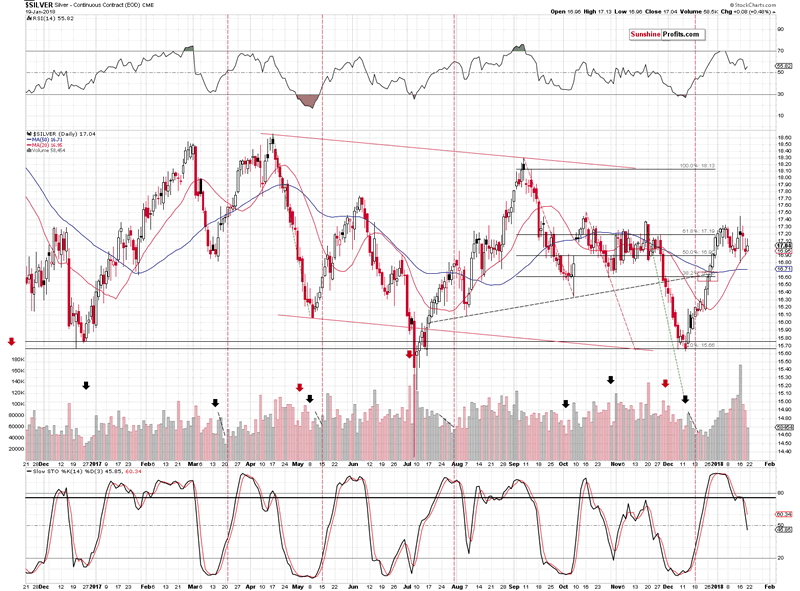
However,on Friday, silver moved higher and the interesting thing about this upswing wasthe volume that accompanied it. It was low, which is generally a bearish sign.
Speakingof silver’s volume, please keep in mind that the implications of the extremelybig volume in the price of the white metal that we saw on Tuesday remain inplace.
Wedescribed them in greater detail in onWednesday:
The volume in silver was epic.One could say that it’s because there was no regular session on Monday, butduring the previous years there were also other cases when there were marketholidays and in no other case was the volume this big. In other words, thevolume is extreme even if we take the above effect into account.
However, it is most importantthat the volume was extremely big – not that it broke a few records. Historytends to repeat itself, so the key question is what silver did after previoussessions when it traded on huge volume.
It usually declined. We markedthe similar sessions with vertical lines and we used the red color for thecases when a bigger decline followed either immediately or shortly. The black linerepresents the session that was not followed by anything specific and the bluesession was followed by higher silver prices in the short term.
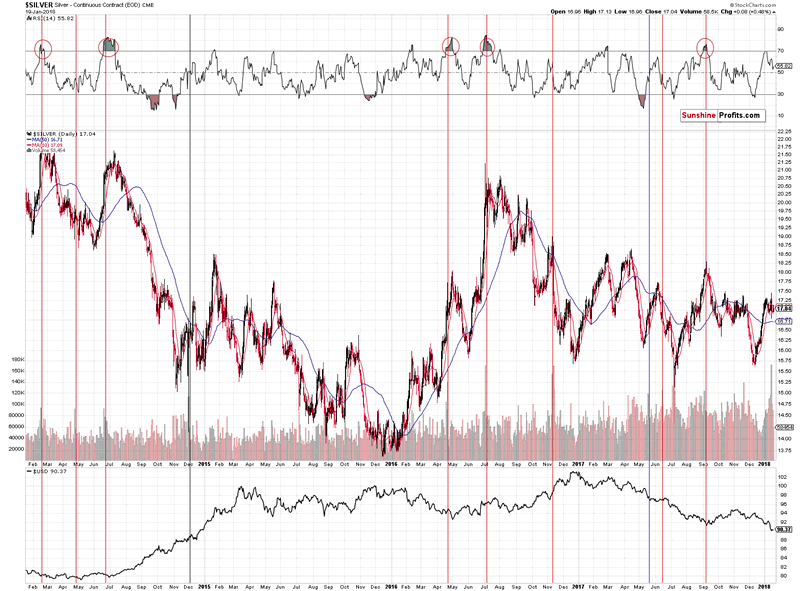
The red sessions dominate, whichmakes the current session bearish. However, what makes it very bearish is consideringthe above together with the RSI indicator. The latter shows the status of themarket when the huge-volume upswing was seen.
Whenever silver moved higher onhuge volume when the RSI was above 60, it meant that a top was in or at hand.We marked those situations with red ellipses. The RSI closed at 62 yesterday,which makes the current combination of signals very bearish.
Has silver topped based theextreme volume reading? It could be the case, but this is not what the abovechart is saying. It’s saying that a big decline is just around the corner andpaying a lot of attention to bullish signs might be misleading.
Knowinghow silver performed for the rest of the previous week, it now seems that thetop has indeed been formed. The white metal had all the reasons to rally and itdidn’t, except for Friday’s tiny 8-cent upswing. Also, the sell signal from theStochastic indicator remains in play.
Summingup, there are multiple signs pointing to lower precious metals prices in thecoming weeks. Two of the most important ones for the short term are therelative price moves of gold stocks, gold and the USD Index, and the turnaroundthat’s likely already happened in mining stocks based on the apex technique.Gold above $1,300 may appear encouraging and bullish, but, in our opinion, longpositions are not the best way to go at this moment.
If you enjoyed the above analysis and would like toreceive free follow-ups, we encourage you to sign up for our gold newsletter –it’s free and if you don’t like it, you can unsubscribe with just 2 clicks. Ifyou sign up today, you’ll also get 7 days of free access to our premium dailyGold & Silver Trading Alerts. Signup now.
Thank you.
Przemyslaw Radomski, CFA
Founder, Editor-in-chief
Toolsfor Effective Gold & Silver Investments - SunshineProfits.com
Tools für EffektivesGold- und Silber-Investment - SunshineProfits.DE
* * * * *
About Sunshine Profits
SunshineProfits enables anyone to forecast market changes with a level of accuracy thatwas once only available to closed-door institutions. It provides free trialaccess to its best investment tools (including lists of best gold stocks and best silver stocks),proprietary gold & silver indicators, buy & sell signals, weekly newsletter, and more. Seeing is believing.
Disclaimer
All essays, research and information found aboverepresent analyses and opinions of Przemyslaw Radomski, CFA and SunshineProfits' associates only. As such, it may prove wrong and be a subject tochange without notice. Opinions and analyses were based on data available toauthors of respective essays at the time of writing. Although the informationprovided above is based on careful research and sources that are believed to beaccurate, Przemyslaw Radomski, CFA and his associates do not guarantee theaccuracy or thoroughness of the data or information reported. The opinionspublished above are neither an offer nor a recommendation to purchase or sell anysecurities. Mr. Radomski is not a Registered Securities Advisor. By readingPrzemyslaw Radomski's, CFA reports you fully agree that he will not be heldresponsible or liable for any decisions you make regarding any informationprovided in these reports. Investing, trading and speculation in any financialmarkets may involve high risk of loss. Przemyslaw Radomski, CFA, SunshineProfits' employees and affiliates as well as members of their families may havea short or long position in any securities, including those mentioned in any ofthe reports or essays, and may make additional purchases and/or sales of thosesecurities without notice.
Przemyslaw Radomski Archive |
© 2005-2018 http://www.MarketOracle.co.uk - The Market Oracle is a FREE Daily Financial Markets Analysis & Forecasting online publication.