Upcoming Turnaround in Gold / Commodities / Gold and Silver 2018
More than two weeks ago, we described thevery specific and very important pattern in the gold market, one of short- andmedium-term importance. We wrote that the triangle apex pattern based on the intradayhighs, pointed to a major reversal in the first half of March. The first halfof March ends this week, so the key question is if the pattern was invalidatedor are we about to see a major reversal in the price of gold.
Inour view, the latter outcome is highly likely as it is confirmed also by other– independent – analogies. Let’s start with going back to the chart that wepresented on February 26th (charts courtesy ofhttp://stockcharts.com).
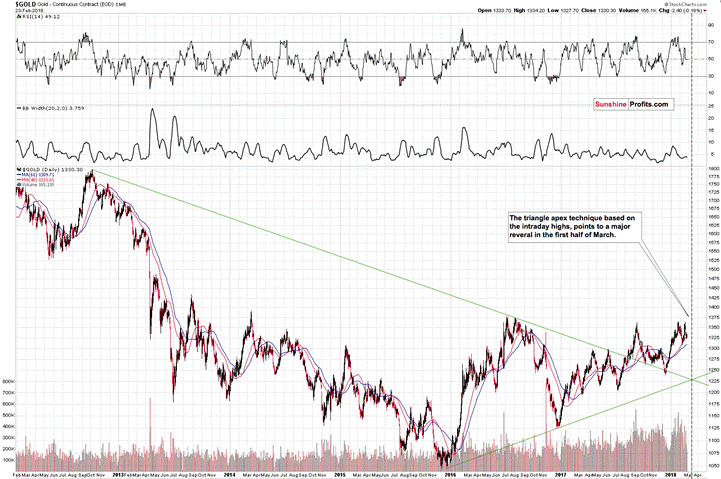
Inthe past two weeks gold didn’t soar – conversely, it was trading sideways andits currently lower than it was when we wrote the above. So, one might bewondering if the implications of the triangle’s apex are actually bullish,since the move in the last two weeks was down. They are not, because this gold forecast technique is based onmedium-term lines, so we should also take medium-term rallies and declines intoaccount while determining the implications of the turnaround.
Thepreceding medium-term move was up – gold moved higher in late December 2017 andfor most of January 2018, topping a bit above $1,360. The back-and-forthmovement since that time is rather a lengthy medium-term topping formation thana combination of price moves that should be analyzed independently – at least fromthe medium-term point of view.
Ofcourse, if gold breaks above the $1,360 with a vengeance and confirms a bigbreakout above it, then the current back-and-forth trading will turn out to bea consolidation within a rally – but that’s not what seems likely at all. Afterall, gold wasn’t able to break above its 2017 and 2016 highs even though theUSD Index declined a few index points below the analogous extremes.
Themedium-term nature of the pattern has an additional important consequence. Itis that we shouldn’t put too much weight on its precision in terms of days. Agood rule of thumb is to zoom in or out on a given chart until the pattern thatyou want to analyze is clearly visible, and then check – without zooming in –if the price is just a bit away from what it should be doing based on the pattern, or not. In the caseof our triangle apex reversal, the moment of reversal is “more or less here”,so if we see a reversal this week, it will be definitely in tune with thepattern – it will not invalidate it.
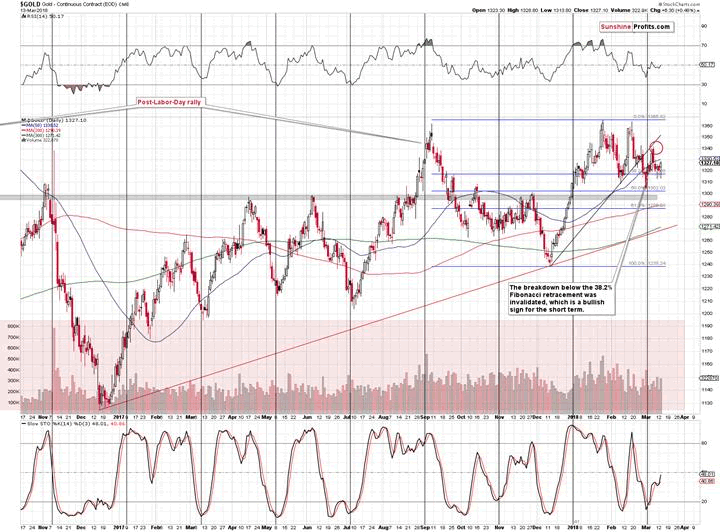
Duringyesterday’s trading, gold moved higher without moving back above the 50-daymoving average. If we are to see a major reversal and a powerful decline thereafter,then we should see / have seen at least some upswing beforehand. After all,what’s to reverse if there was absolutely no rally? Consequently, it seems thatyesterday’s rather small upswing is perfectly understandable in the currentmarket situation. Besides, we wrote in the previous analyses that slightlyhigher prices could be seen. This seems to be it. We don’t expect significantlyhigher gold prices before the reversal, though.
Earliertoday, we wrote that the bearish case is supported by also other analogies. Oneof them is to the previous breakdown below the 50-day moving average.
Backin early December 2017, the breakdown below the 50-day MA was followed by abrief pause and the decline continued only after that time.
Thisis something that we’re seeing also this time – the pause and a small rally isa verification of the breakdown below the MA, which is a bearish gold trading sign.
Silver’sStriking Similarity Continues
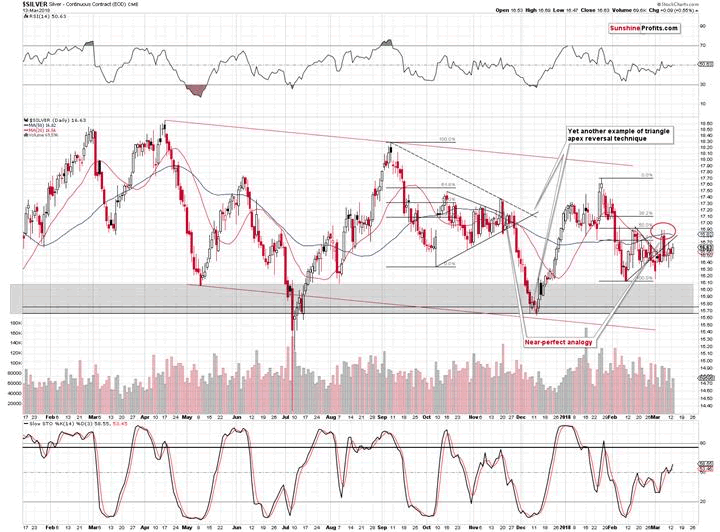
The second analogy can beobserved in the silver market. In the past few weeks, the white metal has beenperforming almost identically as it did after the September 2017 top. The initialdecline, the volatile comeback and another move lower, but not below the initiallow. Then a sharp daily upswing above the 50-day moving average and almost tothe previous high. Then another big move down that erases more than the dailyrally. Finally, a few days of quiet upswing. That’s where we are right now andthat’s exactly what preceded the $1.5 decline in late 2017.
The above paints a clearlybearish forecast for silver.
GoldStocks’ Breakdown Below 2017 Low
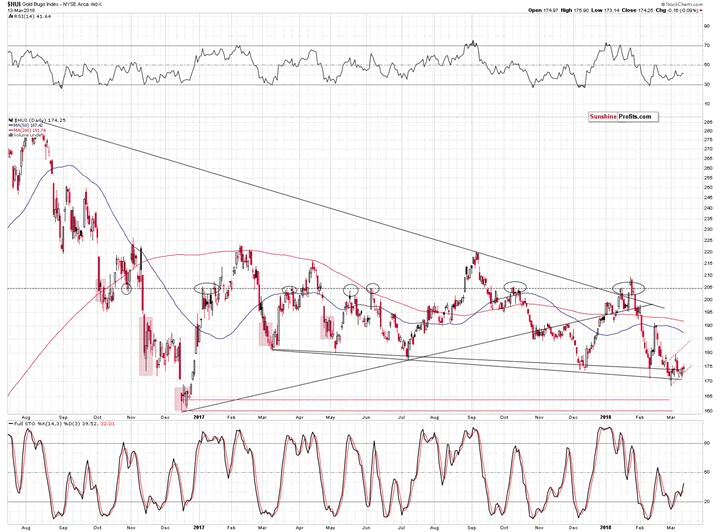
Inyesterday’s Gold & Silver Trading Alert, we wrote that based onthe analogy present in silver, the one in gold and due to gold’s triangle apexreversal, it seemed that the chance of another upswing was very low. Even if itwas seen – we argued – gold miners would be likely to underperform, so a moveto a new March 2018 high didn’t seem to be in the cards.
Yesterday’ssession more or less confirmed the above. Gold and silver moved a bit higherjust as one might have expected them to before a reversal, and silver moved intune with its self-similar pattern. Gold stocks,however, ended the session slightly lower, underperforming and closing onceagain below the 2017 low.
Itseems that the breakdown below the last year’s low is now more than verifiedand thus much lower prices are likely to follow.
Signfrom Europe
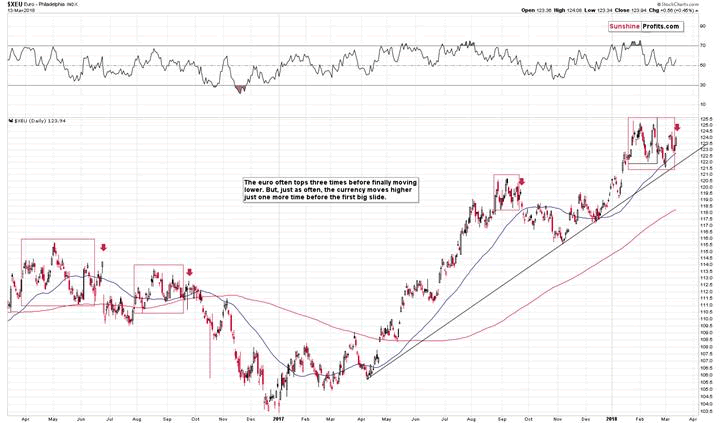
Theinteresting pattern about the euro is that it quite often ends rallies withtriple tops with an extra upswing that sometimes is too temporary to be calledanother top. We marked those cases with red rectangles and we marked those“extra upswings” with red arrows. The temporary nature of the latter can beseen particularly clearly in September 2017.
OnFriday, we wrote that the problem with this analogy and the reason why it didn’tadd clarity to the outlook was the January 25th intraday high. Should we countit as one of the major local tops?
Yes,because ultimately a high was indeed reached. No, because in terms of theclosing prices, nothing really happened on that day.
Basedon the most recent very short-term move higher in the EUR/USD, we know that thesecond interpretation was most likely the correct one. Namely, the intradayhigh didn’t really count and that the top we saw earlier this month was the thirdone. This, in turn, makes yesterday’s rally the “extra upswing” that is seenright before declines. The implications are bearish for the EUR/USD, bullishfor the USD Index and bearish for the precious metals market.
Summary
Summingup, a major top in gold, silver and mining stocks is probably in, and based onthe way silver and gold stocks performed on Friday and the analogies in goldand – especially - silver, it seems that the big decline is just around thecorner. We already saw the key short-term signs: silver’s outperformance andminers’ underperformance last Tuesday, and the fact that they were repeated onFriday makes the bearish outlook even more bearish, especially that our lastweek’s upside targets for gold and silver were alreadyreached.
If you enjoyed the above analysis and would like toreceive free follow-ups, we encourage you to sign up for our gold newsletter –it’s free and if you don’t like it, you can unsubscribe with just 2 clicks. Ifyou sign up today, you’ll also get 7 days of free access to our premium dailyGold & Silver Trading Alerts. Signup now.
Thank you.
Przemyslaw Radomski, CFA
Founder, Editor-in-chief
Toolsfor Effective Gold & Silver Investments - SunshineProfits.com
Tools für EffektivesGold- und Silber-Investment - SunshineProfits.DE
* * * * *
About Sunshine Profits
SunshineProfits enables anyone to forecast market changes with a level of accuracy thatwas once only available to closed-door institutions. It provides free trialaccess to its best investment tools (including lists of best gold stocks and best silver stocks),proprietary gold & silver indicators, buy & sell signals, weekly newsletter, and more. Seeing is believing.
Disclaimer
All essays, research and information found aboverepresent analyses and opinions of Przemyslaw Radomski, CFA and SunshineProfits' associates only. As such, it may prove wrong and be a subject tochange without notice. Opinions and analyses were based on data available toauthors of respective essays at the time of writing. Although the informationprovided above is based on careful research and sources that are believed to beaccurate, Przemyslaw Radomski, CFA and his associates do not guarantee theaccuracy or thoroughness of the data or information reported. The opinionspublished above are neither an offer nor a recommendation to purchase or sell anysecurities. Mr. Radomski is not a Registered Securities Advisor. By readingPrzemyslaw Radomski's, CFA reports you fully agree that he will not be heldresponsible or liable for any decisions you make regarding any informationprovided in these reports. Investing, trading and speculation in any financialmarkets may involve high risk of loss. Przemyslaw Radomski, CFA, SunshineProfits' employees and affiliates as well as members of their families may havea short or long position in any securities, including those mentioned in any ofthe reports or essays, and may make additional purchases and/or sales of thosesecurities without notice.
Przemyslaw Radomski Archive |
© 2005-2018 http://www.MarketOracle.co.uk - The Market Oracle is a FREE Daily Financial Markets Analysis & Forecasting online publication.
