US Monetary Growth Slows. Will Gold Price Accelerate Now? / Commodities / Gold & Silver 2019

 The growth ofthe US money supply has slowed down! We invite you to read our today’s article aboutthe sluggish American monetary inflation, and find out whether it signal theupcoming recession and good times for gold.
We have long beenwarning our Readers about doomsayers who spread excessively pessimisticviewpoint and scare investors with the monster of recession. Our thoroughanalysis suggests – the gold bulls couldnot like this conclusion – that we have a Goldilocks economy and thecurrent expansion still has room to run.
However, we donot downplay the risk of recession. We are not like many market pundits whoexpress naive optimism that this time is different (we are neither the eternaldoomsayers who see writings on the wall everywhere). Instead, we are constantly monitoringeconomy closely to provide you with the in-depth and data-based analysis.
This month wewould like to focus on the money supply, as thepace at which new money is being created in the US (but also in the euro areaand in Japan) has recently slowed down. Indeed, as the chart below shows, inlate 2018, the American monetaryinflation rate dropped below 3.5, the level not seen since 2010.
Chart 1: Theweekly M2 money supply growth rate for the US from January 2009 to May 2019 (in%, year-over-year).
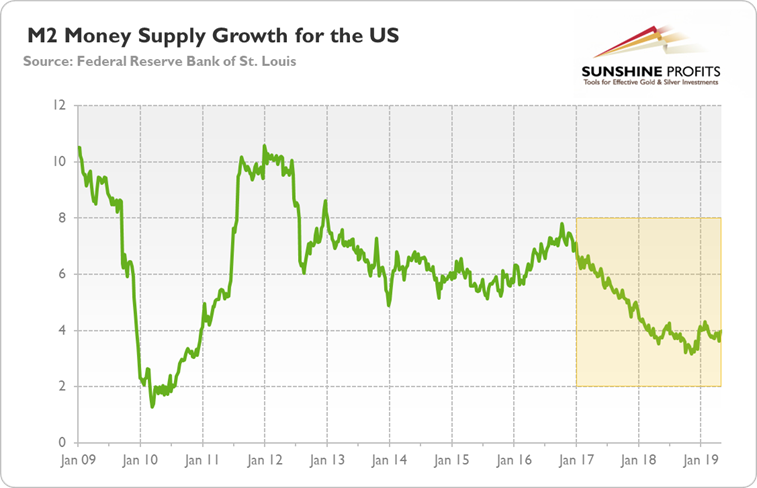
The monetarygrowth has oscillated around 4 percent in 2019, which is still an unusually weak pace. As the quantity of money inthe economy is an important guide to prospect, some market analysts expresstheir concerns about the future economic growth. The slowdown in money supplyexpansion translates into lower spending, they worry. As the monetary growth isbelieved to lead financial conditions, theslow rate of money-supply growth increases the risk of recession in the comingmonths. Indeed, the monetary inflation rate has been below 6 percent sinceJune 2017. Why is it important?
Let’s zoom outof the chart. Historically speaking, the6 percent has been a recessionary threshold. As one can see in the chart,the US monetary inflation dropped below that level before 1990-91 recession,the burst of the dot-combubble and the GreatRecession.
Chart 2: The monthlyM2 money supply growth rate for the US (green line, left axis, in %,year-over-year) and gold prices (red line, right prices, London P.M. Fix, in $)from January November 1981 to May 2019.
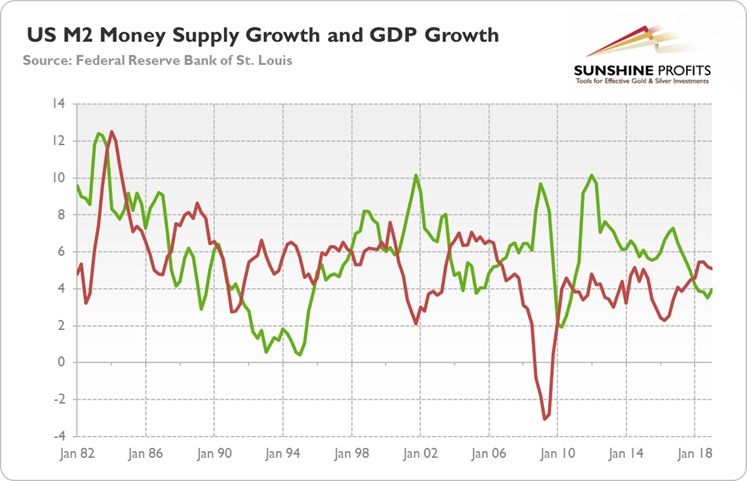
However, the money supply is not the best leadingindicator. The slowdown in the monetary inflation occurs long before theeconomic slowdown – and that time can vary substantially from one businesscycle to the next.And it might be actually the case – there is an age-old macroeconomic debate onthis – that the money supply lags theeconomic conditions.
Indeed, justlook again at the chart above. Both lines behave similarly, but the monetary growth seems to lag a fewquarters behind the economic growth. For example, the former bottomed inthe first quarter of 2010, one year after the through in GDPgrowth. And themonetary growth has been accelerating, not slowing down, in the run-up to thelast financialcrisis.
It makesperfect sense. During good times, people are eager to take new loans, so thesupply of credit accelerates – and so the money supply. Conversely, during badtimes, people do not want to take many new loans, so the growth in the creditsupply, and thus in the money supply, declines. As Charles Goodhart, aprofessor at the London School of Economics, once said: “Slowing monetary aggregates is certainly consistent with a slowingeconomy, but is not the underlying cause.”
What does itall mean for the gold market? Well, the sluggish pace of monetary growth isdisturbing, and it adds another reasonto worry about the recession coming in the near future. If true, goldbulls should likethe slowdown in monetary inflation.
However, the moderate growth of the money supplycould be just a reflection of the Goldilocks economy (we wrote about itprevious part of this edition of the Market Overview), which is neither too hot, nor too cold, but justright. You should not expect strong pace of monetary pumping in economy withsteady growth and low priceinflation. Therefore, the precious metals investors should notread too much into slowing creation of new money. Indeed, as the chart belowshows, the pace of monetary growth does not drive the gold prices.
Chart 3: Themonthly M2 money supply growth rate for the US (green line, left axis, in %,year-over-year) and gold prices (red line, right prices, London P.M. Fix, in $)from January November 1981 to May 2019.
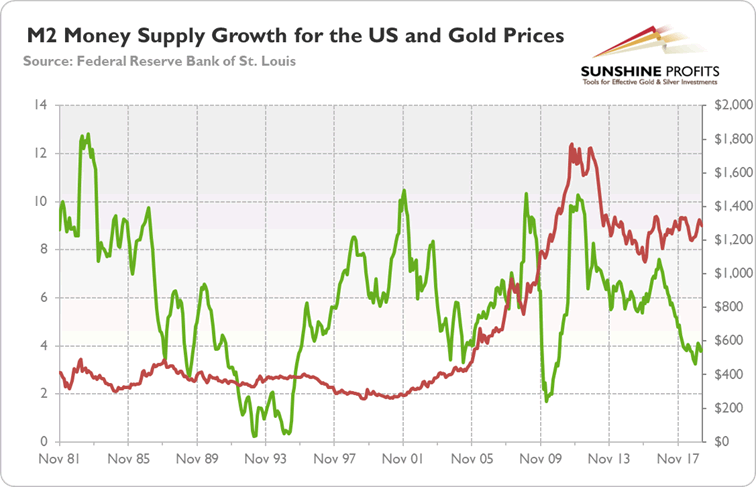
Hence, thecasual link between money supply and the real economy is not determined, whilethe correlation between the growth of money supply and gold pricesis clear – see the chart above – andamounts to almost zero.
If you enjoyed the above analysis and would you like to knowmore about the gold ETFs and their impact on gold price, we invite you to readthe April MarketOverview report. If you're interested in the detailed price analysis andprice projections with targets, we invite you to sign up for our Gold & SilverTrading Alerts . If you're not ready to subscribe at this time, we inviteyou to sign up for our goldnewsletter and stay up-to-date with our latest free articles. It's freeand you can unsubscribe anytime.
Arkadiusz Sieron
Sunshine Profits‘ MarketOverview Editor
Disclaimer
All essays, research and information found aboverepresent analyses and opinions of Przemyslaw Radomski, CFA and SunshineProfits' associates only. As such, it may prove wrong and be a subject tochange without notice. Opinions and analyses were based on data available toauthors of respective essays at the time of writing. Although the informationprovided above is based on careful research and sources that are believed to beaccurate, Przemyslaw Radomski, CFA and his associates do not guarantee theaccuracy or thoroughness of the data or information reported. The opinionspublished above are neither an offer nor a recommendation to purchase or sell anysecurities. Mr. Radomski is not a Registered Securities Advisor. By readingPrzemyslaw Radomski's, CFA reports you fully agree that he will not be heldresponsible or liable for any decisions you make regarding any informationprovided in these reports. Investing, trading and speculation in any financialmarkets may involve high risk of loss. Przemyslaw Radomski, CFA, SunshineProfits' employees and affiliates as well as members of their families may havea short or long position in any securities, including those mentioned in any ofthe reports or essays, and may make additional purchases and/or sales of thosesecurities without notice.
Arkadiusz Sieron Archive |
© 2005-2019 http://www.MarketOracle.co.uk - The Market Oracle is a FREE Daily Financial Markets Analysis & Forecasting online publication.