USD Index Sheds Light on the Upcoming Gold Move / Commodities / Gold & Silver 2020

The yellow metal and its fiat nemesis. Gold and thedollar certainly move not in a random relation to each other. The strength anddirection of one taking the cue from the other changes over time, but what doesit tell us about the present moment?
The key point with regard to the US currency is that it appears to have alreadyended its pullback and is now ready to soar well above its previous 2020 high.
How do we know that the pullback is most likelyover?
Because the USD Index already rallied for (actuallymore than) two consecutive trading days.
USDX on the Rise
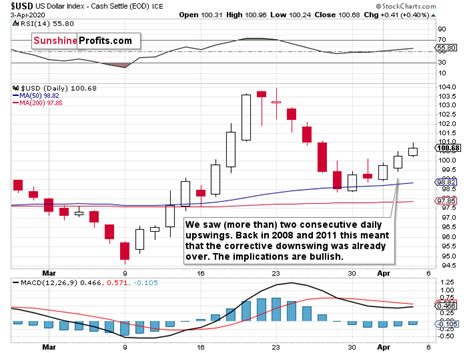
The USD Index just posteda daily rally and it was the third daily rally in a row. This may not seemsignificant at first sight, but it is significant, because that was whatconfirmed that the downward correction was already over in case of both similarprice moves: the 2008 and 2011 one.
We compared thecorrections in similar times and here's what we found.
Based on the above chart,we see that there were two similar cases to what we see today - one in 2008 andthe other in 2011. These years are also similar due to the fact that in bothcases we saw major tops in gold.
Given the size of themost recent rally, the 2014-2015 rally might appear similar, but the correctionthat we saw back then, was not big enough and the preceding rally was not sharpenough to be really comparable. That's why we're focusing on 2008 and 2011.
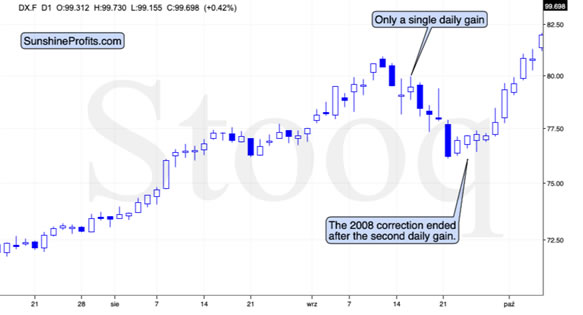
In 2008, the USDXcorrected a bit below its 50% retracement, but not to its 61.8% retracement -just like it did recently. There were moves both up and down during thecorrective downswing, and the thing that confirmed its end, was the seconddaily gain.
And in 2011?
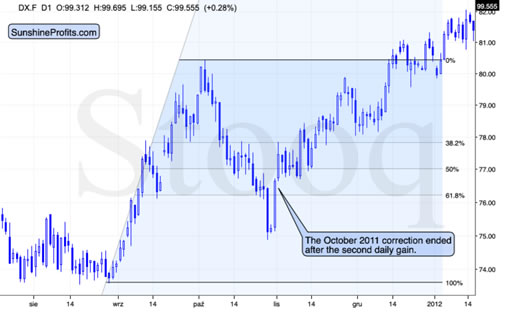
Exactly the same thingwas the case. The shape of the decline was different, and the decline wasdeeper (it moved below the 61.8% retracement but the USDX stayed there for just2 trading days), but once we saw two daily gains in a row, it served as aconfirmation that the decline was over.
We already got thisbullish confirmation, so the USD Index’s rally is now likely to continue.
The good news is thatsince we know that the correction is most likely over, we can use Fibonacciextension tools based on the previous rally and the correction to estimate howhigh the USD Index is likely to move before this significant, yet short-termrally is over. Once the short-term rally is over, it would probably be followedby a more meaningful correction and then another wave up, but that’s not thekey information from the precious metals investor’s and trader’s point of view,because PMs and miners are likely to bottom even before the USD Index tops.
So, how high would theUSD Index be likely to rally in the near term?
Back in 2008, the USDIndex topped after it slightly exceeded the level that one would get bydoubling the size of the initial sharp upswing. The first, initial top formedslightly above the level that one would get by multiplying the size of theinitial sharp correction by 2.618.
Based on these techniquesand the analogy to 2008, the USD Index is likely to soar to about 113 beforecorrecting in a more meaningful manner. This level is just above the rising,long-term resistance line that’s based on the 2009 and 2015 highs, which is atabout 112, so conservatively we will view 112 as our upside target.
The USD Index is at about100 at the moment of writing these words, so the upside potential issubstantial.
And as we wrote in manyprevious extensive analyses, big moves higher in the USD Index almost alwaystranslate into big declines in gold. Consequently, given a high-qualityprediction for the USD Index, one is quite likely to make a good goldprice forecast as well.
The BigPicture View of the USD Index and Gold
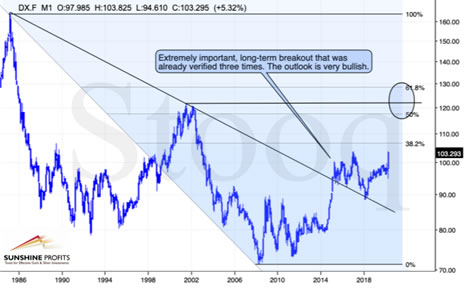
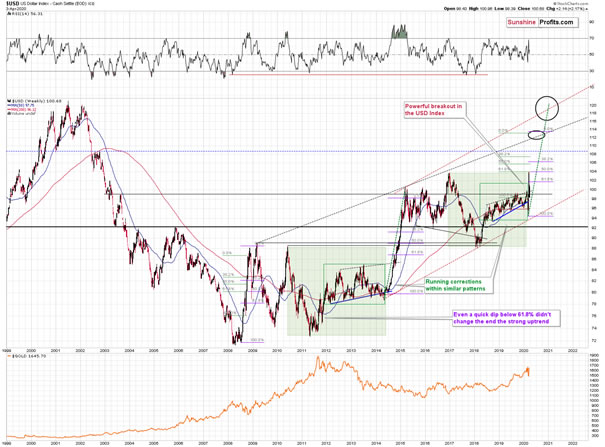
The2014-2015 rally caused the USD Index to break above the decliningvery-long-term resistance line, which was verified as support threetimes. This is a textbook example of a breakout and we can't stressenough how important it is.
Themost notable verification was the final one that we saw in 2018. Since the 2018bottom, the USD Index is moving higher and the consolidation that it's been infor about a year now is just a pause after the very initial part of the likelymassive rally that's coming.
Ifeven the Fed and the U.S. President can't make the USD Index decline for long, just imaginehow powerful the bulls really are here. The rally is likely to be huge and theshort-term (here: several-month long) consolidation may already be over.
Thereare two cases on the above chart when the USD Index was just starting itsmassive rallies: in the early 1980s and in mid-90s. What happened in gold atthat time?
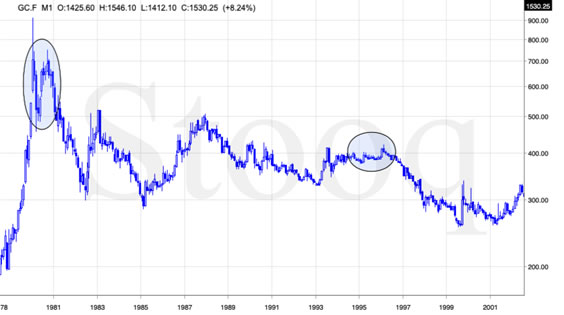
Thesewere the starting points of gold's most important declines of the pastdecades. The second example is much more in tune with the currentsituation as that's when gold was after years of prolonged consolidation.The early 1980s better compare to what happened after the 2011 top.
Pleasenote that just as what we saw earlier this year, gold initially showed somestrength - in February 1996 - by rallying a bit above the previous highs. TheUSD Index bottomed in April 1995, so there was almost a yearly delay in gold'sreaction. But in the end, the USD - gold relationship worked as expectedanyway.
TheUSD's most recent long-term bottom formed in February 2018 and gold seems tohave topped right now. This time, it's a bit more than a year of delay, butit's unreasonable to expect just one situation to be repeated to the lettergiven different economic and geopolitical environments. The situations are notlikely to be identical, but they are likely to be similar - and they indeedare.
Whathappened after the February 1995 top? Gold declined and kept on declining untilreaching the final bottom. Only after this bottom was reached, a new powerfulbull market started.
Pleasenote that the pace at which gold declined initially after the top - in thefirst few months - was nothing to call home about. However, after the initialfew months, gold's decline visibly accelerated.
Let'scompare the sizes of the rallies in the USDX and declines in gold. In the early80s, the USDX has almost doubled in value, while gold's value was divided bythe factor of 3. In the mid-90s, the USDX rallied by about 50% from its lows,while gold's value was divided by almost 1.7. Gold magnified what happened inthe USD Index in both cases, if we take into account the starting and endingpoints of the price moves.
However,one can't forget that the price moves in USD and in gold started at differenttimes - especially in the mid-90s! The USDX bottomed sooner, which means thatwhen gold was topping, the USDX was already after a part of its rally.Consequently, when gold actually declined, it declined based on only part ofthe slide in the USDX.
So,in order to estimate the real leverage,it would be more appropriate to calculate it in the following way:
Gold's weekly close at the first week of February 1996: $417.70USDX's weekly close at the first week of February 1996: 86.97Gold's weekly close at the third week of July 1999: $254.50USDX's weekly close at the third week of July 1999: 103.88TheUSD Index gained 19.44%
Goldlost 39.07% (which means that it would need to gain 64.13% to get back to the$417.70).
Dependingon how one looks at it, gold actually multiplied USD's moves 2-3 times duringthe mid-90 decline.
Andin the early 1980s?
Gold's weekly close at the third week of January 1980: $845USDX's weekly close at the third week of January 1980: 85.45Gold's weekly close at the third week of June 1982: $308.50USDX's weekly close at the third week of June 1982: 119.01TheUSD Index gained 39.27%
Goldlost 63.49% (which means that it would need to gain 173.91% to get back to$845).
Dependingon how one looks at it, gold actually multiplied USD's moves by 1.6 - 4.4 timesduring the early-80 decline.
Thismeans that just because one is not using U.S. dollars as their primarycurrency, it doesn't result in being safe from gold's declines that areaccompanied by USD's big upswings.
Inother words, the USD Index is likely to soar, but - during its decline - goldis likely to drop even more than the USD is going to rally, thus falling interms of many currencies, not just the U.S. dollar.
Pleasenote that there were wars, conflicts and tensions between 1980 and 2000. Andthe key rule still applied. Huge rallies in the USD Index mean huge declines ingold. If not immediately, then eventually.
Consequently, it seems most likely that while theUSDX rallies, gold would first rally to or slightly above its 2020 highs(topping today or tomorrow), and decline in a volatile manner shortlythereafter.
For now, it seems mostlikely that we’ll get the final bottom in gold close to the middle of the monthor in itssecond half. Perhaps on EasterMonday, when trading is more difficult in many parts of the world (as themarkets are closed there) – that’s exactly when silver topped in 2011.
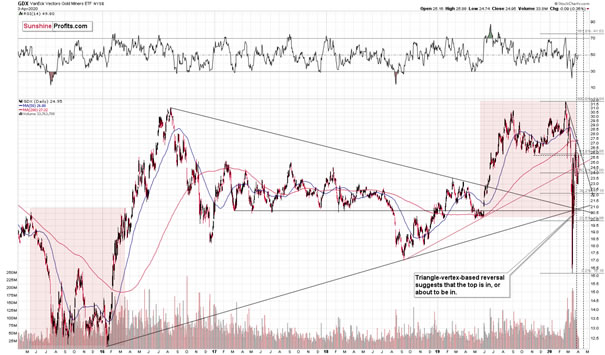
Also, let’s keep in mindthat we have a medium-term triangle-vertex-basedreversal in the middle of the month in the GDX ETF.
What happened in othermarkets once gold rallied for the final time in 2008? Silver and mining stocksmoved higher, but not as significantly as gold. Neither silver, nor miningstocks moved above their previous highs. The general stock market moved back and forth, mostly doing nothing, and the USD Index rallied.
What’s happening rightnow in the stocks and the USD Index? The stocks are moving back and forth,while the USD Index is moving higher and it just rallied for two consecutivedays.
Silver moved higher, butnot above its recent high, and miners corrected about half of their most recentdownswing. It seems that the two periods in 2008 and 2020 (both marked withgreen) are indeed very similar.
Note: silvermight exceed its recent high temporarily as the market might focuson the industrial demand due to the upcoming infrastructure projects. That’sunlikely to be anything more than a temporary development.
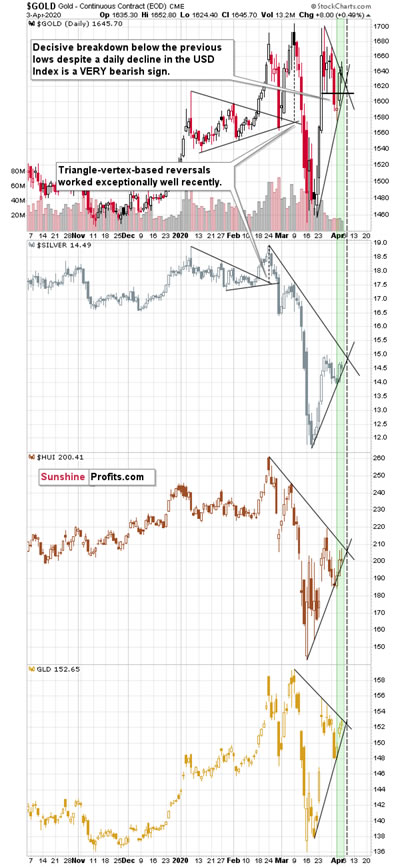
As you can see, there arethere are triangle-vertex-based reversals early this week in all key parts ofthe precious metals sector: in gold, in silver, and the mining stocks. We alsoget the same indication based on the GLD ETF.
This means that – basedon this tradingtechnique - it’s very likely that we’ll see some kind of reversal today or tomorrow. Based on the analogy to2008, it’s likely to be a local top, even despite the rally in the USD Index.
Today's article is asmall sample of what our subscribers enjoy on a daily basis. They know aboutboth the market changes and our trading position changes exactly when theyhappen. Apart from the above, we've also shared with them the detailed analysisof the miners and the USD Index outlook. Check more of our free articles on our website, including this one – justdrop by and have a look. Weencourage you to sign up for our daily newsletter, too - it's free and if youdon't like it, you can unsubscribe with just 2 clicks. You'll also get 7 daysof free access to our premium daily Gold & Silver Trading Alerts to get ataste of all our care. Signup for the free newsletter today!
Thank you.
Przemyslaw Radomski, CFA
Founder, Editor-in-chief
Toolsfor Effective Gold & Silver Investments - SunshineProfits.com
Tools für EffektivesGold- und Silber-Investment - SunshineProfits.DE
* * * * *
About Sunshine Profits
SunshineProfits enables anyone to forecast market changes with a level of accuracy thatwas once only available to closed-door institutions. It provides free trialaccess to its best investment tools (including lists of best gold stocks and best silver stocks),proprietary gold & silver indicators, buy & sell signals, weekly newsletter, and more. Seeing is believing.
Disclaimer
All essays, research and information found aboverepresent analyses and opinions of Przemyslaw Radomski, CFA and SunshineProfits' associates only. As such, it may prove wrong and be a subject tochange without notice. Opinions and analyses were based on data available toauthors of respective essays at the time of writing. Although the informationprovided above is based on careful research and sources that are believed to beaccurate, Przemyslaw Radomski, CFA and his associates do not guarantee theaccuracy or thoroughness of the data or information reported. The opinionspublished above are neither an offer nor a recommendation to purchase or sell anysecurities. Mr. Radomski is not a Registered Securities Advisor. By readingPrzemyslaw Radomski's, CFA reports you fully agree that he will not be heldresponsible or liable for any decisions you make regarding any informationprovided in these reports. Investing, trading and speculation in any financialmarkets may involve high risk of loss. Przemyslaw Radomski, CFA, SunshineProfits' employees and affiliates as well as members of their families may havea short or long position in any securities, including those mentioned in any ofthe reports or essays, and may make additional purchases and/or sales of thosesecurities without notice.
Przemyslaw Radomski Archive |
© 2005-2019 http://www.MarketOracle.co.uk - The Market Oracle is a FREE Daily Financial Markets Analysis & Forecasting online publication.