USD's Weekly Breakout and the Gold Golden Spring / Commodities / Gold and Silver 2018
 USDX’s Friday’s close was its highest weekly closingprices of 2018. This is an extremely significant confirmation of the bullishoutlook for the US currency that followed the verification of the breakoutabove the inverse head-and-shoulders pattern. The implications are clearly bullishfor the US dollar. But are they clearly bearish for gold? The yellow metalended the week close to its October lows and the SLV ETF closed at the highestlevel since late August. Is the outlook for the precious metals market reallybearish?
Yes, it is. Precious metals’ reaction to the actionin the USD could be delayed at times and it's most likely the case also thistime. The current times are far from being calm due to the recent volatility onthe stock market and because we are just before US elections. Consequently,it’s not that odd to see gold and silver hold up relatively well despite thebuild-up in the bearish implications from many long-term charts and from theUSD Index.
Precious metals’performance is like a coiled spring. Once the tensions regarding thestock market and elections are gone (or they diminish in a meaningful way – forinstance the business can be back to normal after the elections), gold, silver, and mining stocksare likely to catch up with their signals and decline in a very profound way.
And we have short-term confirmations that this islikely the case.
RelativeValuations
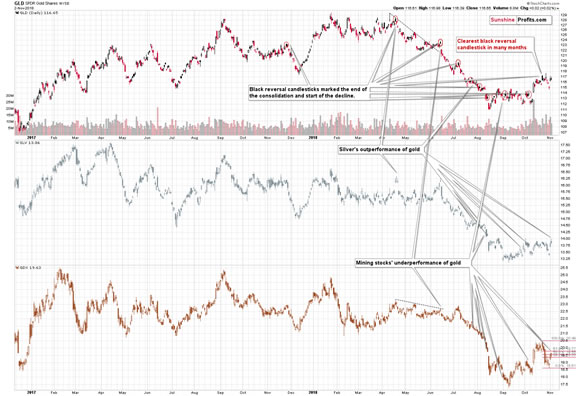
Oneof the most useful gold trading tips in general is theshort-term relative performance of silver and mining stocks relative to gold. Localtops are very often accompanied by underperforming miners and outperformingsilver. That’s exactly what we saw in the final part of the previous week.
TheSLV ETF closed the day above the previous recent daily closing prices, whilethe GLD ETF didn’t. The GDX ETF (proxy for miners) was only a big above the 50%retracement from the recent highs. Minersunderperformed, while silver outperformed, and the implications are bearish.
SLV’sbreakout in terms of the closing prices is an interesting sign on its own assilver is known for its fake breakouts. If silver is breaking above a certainlevel, but gold and mining stocks are not confirming this sign, the silverbreakout is likely a fake one and it’s likely to be followed by an invalidationand – quite likely – a sharp decline.
It’sworth keeping in mind that silver’s breakout is only a veryshort-term phenomenon.
Silver’sand Gold’s Long-term Signals
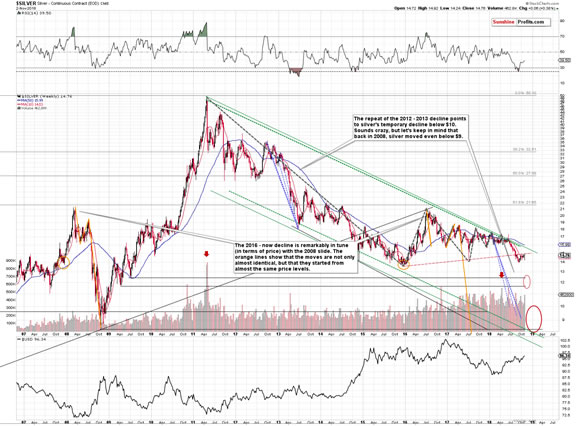
Fromthe broad perspective, it’s clear that the white metal remains below thepreviously broken rising long-term support / resistance line. It’s currently atabout $15, so even a move to this level would not change anything from thetechnical point of view.
Thebreakdown below this important line and its confirmation makes the move lowervery likely. The 2015 lows are quite close to the current price, so it’sunlikely that they will be able to stop the decline. After all, the size of themove that follows a consolidation is likely to be similar to the size of thepreceding move. The preceding decline took silver more than $3 lower, so it’squite likely that we’ll get a slide to about $11 - $12.50 area instead of a onethat ends at the 2015 bottom.
Asa reminder, that’s not where we expect the decline to end. We may (and arelikely to) get a bounce from these levels (perhaps the 2015 bottom will beverified as resistance as silver moves back to it) and then a final decline tothe true bottom at extremely scary price levels – quite likely at or below $10.
Gold’s long-term chart can also tell ussomething interesting.
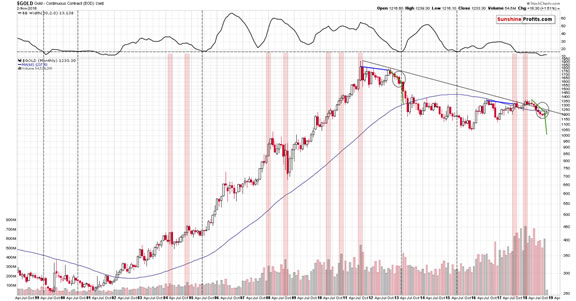
Last week we emphasized howsimilar the situation in gold is to what happened in 2013 and in today’sanalysis we’ll revisit this issue, while looking at monthly price changes.
Therewas only one monthly upswing in gold during the huge 2012 – 2013 decline. Therewas also only one monthly upswing (March 2013) in case of the decline thatstarted in the first half of this year. And it was last month. This suggeststhat we are quite likely just before the biggest and most volatile part of thedecline. It’s not the time to put one’s guard down. It’s the time to beextremely alert and positioned accordingly.
Goldis higher this month, but this doesn’t invalidate anything. In April 2013,right before the decline, we first saw a move higher that took the yellow metalabove the previous month’s (March) closing price, but not above its intradayhigh. October’s closing price was $1,215, and its intraday high was $1,246. Goldis currently trading around the $1,230 price level – in perfect tune with howhigh it moved in April 2013, just days before the big plunge.
The 2013 – now link remainsintact; and the bearish goldprice forecast appears to be welljustified.
Let’stake a moment to review the performance of the USD Index.
USDX’sConfirmed Breakouts
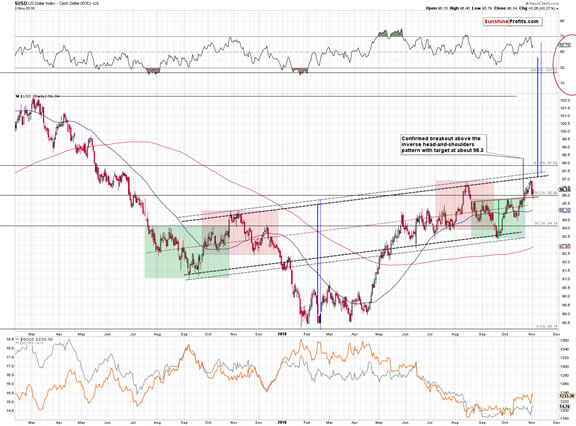
Thebreakout above the inverse head-and-shoulderspattern was confirmed by many daily closes, weekly and monthly closes, and a move backto it that was followed by a rally. In other words, it was confirmed bypractically all possible ways. It’s also in tune with the long-term bullishanalogy, and this strength took place while Trump openly criticized Fed, whichshould have caused the value of the US currency to decline. And it ralliedinstead. It’s really hard to imagine a more powerful bullish combination offactors.
Ok,if (which – based on the above – is more of a “when” issue than “if”) we get a confirmedbreakout above the medium-term inverse head-and-shoulders, the implications forthe following weeks will be even more bullish, but as far as short-term isconcerned, we have it all.
Whyis this so important for the precious metals market. The obvious reason is thatbecause of the long-term negative link between gold and the USDX, rallying USDis likely to translate to declining gold prices sooner or later. But, there’salso a less clear reason that is just as important from the analytical point ofview.
Ifthe USD Index is going to rally in the following weeks and we are wrong aboutthe medium-term outlook for gold, silver, and mining stocks, then it means thatwe will likely not see soaring PMs anyway, but rather a continuation of thesideways trading pattern. This would give us a lot of time to adjust ourpositions and perhaps to get in the precious metals market with the long-terminvestment capital. While it doesn’t directly affect the portfolio, it createsan “analytical safety net” as it’s likely that we would get very clear “changeyour mind already!” signals from the gold-USDX link. At this time, this signalis not present due to the reasons that we outlined earlier. Namely, gold,silver, and mining stocks are likely kept up due to the increased (buttemporary) level of uncertainty and tensions regarding the general stockmarket’s performance and the US elections. Oncethe business is back to normal, gold will likely catch up with its long-termindications and decline in a meaningful way.
Thiscompletes the short-term part of the analysis, but it doesn’t complete theentire essay just yet. Before summarizing, we would like to update you on the triangle-vertex-based reversals for the entireprecious metals sector.
Gold’s,Silver’s, and Mining Stocks’ Reversal Dates
Let’sstart with discussion of the reversals in gold.
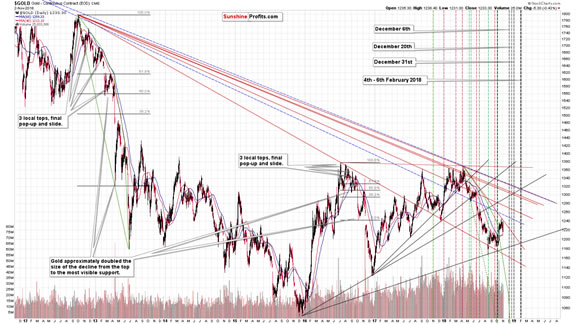
In March, 2018, we featured thetriangle-apex-based (a.k.a. triangle-vertex-based) reversals and it turned outthat practically all the turning points marked with this technique worked inone way or another. Sometimes, the tops were important and sometimes they werevery brief. But in practically all cases, the technique was useful. Thevertical lines that are from the recent past were black as their implicationswere unclear in the past and – without moving them - we just changed theircolor depending on what implications they had. Please take a moment to checkhow well this technique worked. The consequence is that we will attribute evengreater weight to these gold signals in the future.
However,the main reason that we mention the above is that we updated the calculationsbased on the most recent price extremes and that the outlook itself changed abit as the current decline takes longer than we had originally expected it totake. When the underlying facts change, the analysis should be adjusted basedon them, so that it’s always up-to-date. Basing one’s outlook and tradingpositions on previous signals that are no longer in place (for instance holdingon to a long position in the precious metals sector because of the inversehead-and-shoulders in the mining stocks that was already invalidated) is one ofthe ways to lose capital over time. Staying objective and up-to-date is a wayto grow it.
Movingback to the point, we have four triangle-based reversals ahead. The first oneis on December 6th, the second one on December 20th, third one on December31st, and the final one between February 4th and 6th.
Thereason for two dates in case of the latter is that it’s actually based on threeseparate triangles. One of them is based on the December 2015 and August 2018bottoms, and the April 2018 and October 2018 tops. The remaining two ones areof long-term nature. They are based on the rising line that’s based on theDecember 2015 and December 2016 bottom and the declining long-term lines thatare (both) based on the April 2018 high, the late-2012 high and the 2011 high.
Thelast time we saw a reversal that was based on more than one triangle was theearly October bottom and it was indeed followed by a sharp rally. This makes iteven more likely that the early February 2019 reversal will be a veryimportant reversal. Perhaps it will be THE final bottom for the current decline– with gold at about $890.
Ifso, then the previous 3 reversals might correspond to the initialbounce (move to the $1,050 level or so in gold in early December) and the endof the corrective upswing close to the end of the month (either close to 20thor 31st).
Naturally,the above is the possible gold’sperformance that seems likely based on the information that we have available right now.Once more details become available, we will adjust our analysis accordingly.
Let’ssee how the above fits the reversal dates for silver.
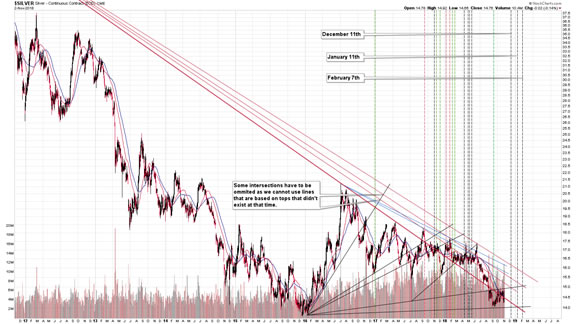
Inshort, it fits them very well. The first of the upcoming reversal dates is onDecember 11th, the second is on January 11th, and thethird is on February 7th.
Thelines that cross at the above dates are different than those that we see ingold, so the fact that the reversal dates in silver are similar to the ones ingold is quite astonishing. The similarity is not perfect in case of theDecember and January reversals, but it is clearly present in case of theFebruary one.
Takingboth charts into account and their own implications, we get a situation, inwhich the precious metals market is likely to reverse initially close to themiddle of December 2018 and then once again in early January. Both are not veryprecise, though, and additional signs should be considered before adjustingone’s position. The key take-away is that a major reversal is likely to take place in the first half of February,2019. This target is confirmed not only by three triangle-vertex-basedreversals in gold, but also by one in silver.
Whatabout the miners?
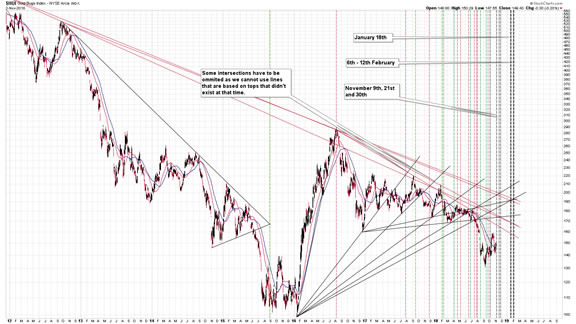
Thereare several reversals that are just around the corner and the nearest is thisFriday and then there are two close to the end of November (21st and30th). There is only one similar case in the recent past, when wesaw similar amount of reversal dates in a relatively short period. It’s Julyand early August and that’s when miners declined in a profound way.
Inaddition to this month’s reversal dates, we have only two nearby reversal datesbased on the triangles’ vertexes, and they are both based on more than one vertex.They are based on two declining red resistance lines and two rising supportlines (one starts at the early 2016 bottom and the other starts at thelate-2016 bottom).
Thefirst strong reversal is on January 18th and the second is betweenFebruary 6th and 12th (the two vertexes are not inperfect tune, but close enough to be taken into account together).
Thereversal prediction for January gets blurrier based on the above as the onefrom gold points to a reversal either at the end of 2018 or in the firstsession of 2019, silver points to a reversal on January 11th, andminers vertex suggest a turnaround on 18th. It could be the casethat different parts of the PM market reverse at different times, or it couldbe the case that we will have a very volatile market in January with severalreversals. At this time it’s impossible to say which of the above is morelikely.
Themost profound implication of the above chart, however, is the fact that we geta reversal prediction in the first half of February, 2019. It’s betweenFebruary 6th and February 12th, so it perfectly fits thedates that we get based on gold’s and silver’s charts.
Consequently,the most important and strongest indication that we get from all three of theabove charts, is that the precious metals sector is very likely to reverse inearly February 2019. Based on the shape of gold’s decline in 2013 and theanalogy to the current decline, thefirst half of February is currently the most likely time target for THE finalbottom in gold and the rest of the precious metals sector.
Summary
Summingup, the outlook remains strongly bearish for the precious metals sector and thefact that PMs are not yet responding to USD’s strength doesn’t invalidate it.The current back and forth trading is tiring, and/or boring depending on one’sperspective (tiring from the short-term one, and boring from the long-termone), but it’s very likely that the patience here will be well rewarded.Silver’s outperformance and miners’ underperformance suggests that we willlikely not have to wait much longer.
Tobe clear, gold is still likely to rally to$6,000 or so, but not before declining significantly first.
Ona side note, before calling us perma-bears, please note that we were bullish (in terms oflong-term investments) on precious metals for years – until April 2013.We’re looking for the true bottom in the precious metals sector, not becausewe’re its or gold investors’ enemy. Conversely, we’re that true friend that tells you ifsomething’s not right, even if it may be unpleasant to hear.
Naturally,the above is up-to-date at the moment of publishing it and the situation may –and is likely to – change in the future. If you’d like to receive follow-ups tothe above analysis (including the intraday ones, when things get hot), weinvite you subscribe to our Gold &Silver Trading Alerts today.
Thank you.
Przemyslaw Radomski, CFA
Founder, Editor-in-chief
Toolsfor Effective Gold & Silver Investments - SunshineProfits.com
Tools für EffektivesGold- und Silber-Investment - SunshineProfits.DE
* * * * *
About Sunshine Profits
SunshineProfits enables anyone to forecast market changes with a level of accuracy thatwas once only available to closed-door institutions. It provides free trialaccess to its best investment tools (including lists of best gold stocks and best silver stocks),proprietary gold & silver indicators, buy & sell signals, weekly newsletter, and more. Seeing is believing.
Disclaimer
All essays, research and information found aboverepresent analyses and opinions of Przemyslaw Radomski, CFA and SunshineProfits' associates only. As such, it may prove wrong and be a subject tochange without notice. Opinions and analyses were based on data available toauthors of respective essays at the time of writing. Although the informationprovided above is based on careful research and sources that are believed to beaccurate, Przemyslaw Radomski, CFA and his associates do not guarantee theaccuracy or thoroughness of the data or information reported. The opinionspublished above are neither an offer nor a recommendation to purchase or sell anysecurities. Mr. Radomski is not a Registered Securities Advisor. By readingPrzemyslaw Radomski's, CFA reports you fully agree that he will not be heldresponsible or liable for any decisions you make regarding any informationprovided in these reports. Investing, trading and speculation in any financialmarkets may involve high risk of loss. Przemyslaw Radomski, CFA, SunshineProfits' employees and affiliates as well as members of their families may havea short or long position in any securities, including those mentioned in any ofthe reports or essays, and may make additional purchases and/or sales of thosesecurities without notice.
Przemyslaw Radomski Archive |
© 2005-2018 http://www.MarketOracle.co.uk - The Market Oracle is a FREE Daily Financial Markets Analysis & Forecasting online publication.
