USDX, Gold Miners: The Lion and the Jackals / Commodities / Gold and Silver Stocks 2021

The USD Index let out a roar heardacross all markets. The king of the financial jungle arrived, along with thegreenback’s largest single-day gain.
Just as the African landscape sometimesneeds to show the strongest of its inhabitants, so does the less remote butequally ferocious financial environment. This time, the USDX seems to have wonthe fight – its fangs and claws turned out to be the sharpest, and so are therallies. There is nothing left for gold and its acquaintances than to runthrough the forest… run.
Sometimes, even jackals need to findshelter to lick their wounds in patience, waiting for a better time to comeback to fight. However, they will come back eventually – they always do.
WhatAbout Gold, One of the Jackals?
With a triple-top in gold’s stochasticoscillator akin to three warning signs of a nervous breakdown, the yellow metalis still recovering from last week’s crisis of confidence. And with the priceaction mirroring what we witnessed in early January – right before goldsuffered a significant slide – the yellow metal could soon need therapy.
Please see below:
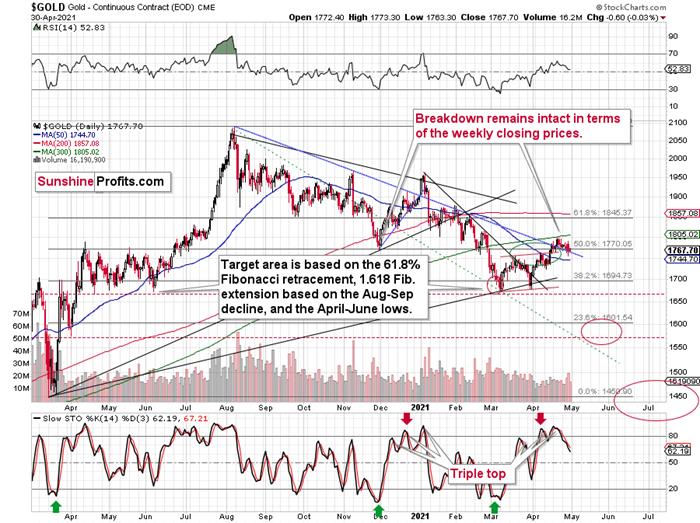
To explain, while gold’s correctiveupswing was slightly bigger than I had anticipated, please note that the lengththereof was in tune with the border of the green ellipse I used to mark thelikely upside target area. In other words, the recent rally was not a game-changer . The yellow metal’s inabilityto crack $1,800 highlights the medium-term implications that I’ve been warningabout. As a result, it’s become increasingly clear that gold’s recent strengthwas nothing more than a short-term upswing within a medium-term downtrend.
For more on the significance of gold’sstochastic oscillator, I wrote previously:
Thefirst sell signal occurred slightly below the 80 level, the second was aboveit, and the same was the case with the third one.
Sinceback in early 2021, the stochastic indicator moved to new highs – and so far ithasn’t – and since the USD Index might even move slightly lower before findingits short-term bottom, gold could move slightly higher on a temporary basis,before topping. Perhaps (there are no certainties on any market, but this seemsquite possible in the near term) it would be the round nature of the $1,800level and the 300-day moving average that’s very close to it that would triggera reversal and another massive decline. From the medium-term point of view,another $20 rally doesn’t really matter. It’s the few-hundred-dollar declinethat’s likely to follow that really makes the difference.
Inaddition, it seems that gold is moving in a way that’s somewhat similar to whatwe saw between mid-April 2020 and mid-June 2020. It’s trading sideways below$1,800 but above ~$1,660. Back in 2020, the range of the back-and-forthmovement (size of the short-term rallies and declines) was bigger, but thepreceding move was also more volatile, so it’s normal to expect smallershort-term volatility this year (at least during this consolidation).
Whyis this particularly interesting? Because both consolidations (the mid-April2020 – mid-June 2020 one and the March 2021 – today one) could be the shouldersof a broad head-and-shoulders pattern, where the mid-June 2020 – early-March2021 performance would be the head. The breakdown below the neck level – atabout $1,660 – would be extremely bearish in this case because the downsidetarget based on the pattern is created based on the size of the head. The targetbased on this broad pattern would be at about $1,350 (I marked it with a thindashed red line on the chart below – you might need to click on it to expand itfor this line to become visible). Is this level possible? It is. When goldsoared above $2,000, almost nobody thought that it would decline back below its2011 highs (well, you – my subscribers – did know that). Gold below $1,500seems unthinkable now, but with rallying long-term rates and soaring USD Index,it could really happen.
The Lion - USD Index (USDX)
After delivering a ferocious 0.75%rally on Apr. 30 – the greenback’s largest single-day gain since Mar. 4 – theUSD Index let out a roar that was heard across all corners of the financialmarkets. And while gold, silver and mining stocks are still cackling indisobedience – as evidenced by the trios’ decelerating correlations over thelast 10 days – every once in a while, the lion has to show the jackals who he is.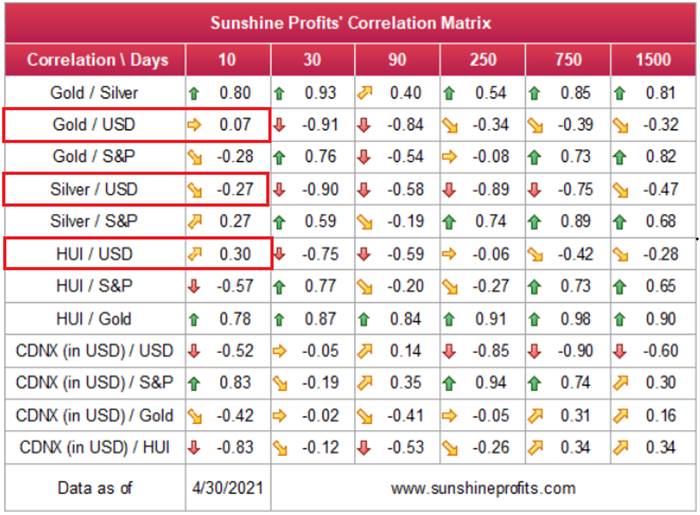
To explain, as the USD Index’s recentplight elicits whispers of a new order in the currency kingdom, the greenback’sstoic behavior has been misjudged as weakness. And while the vultures circleand prophecies of the USD Index’s demise become louder, the lion is slowlymoving to his feet.
Case in point: with the zeitgeistforecasting new lows for the greenback, non-commercial (speculative) futurestraders are still holding firm. Despite the greenback’s suffering, theimmaterial decline in net-long positioning last week was relatively muted andhighlights investors’ quiet respect for the U.S. dollar.
Please see below: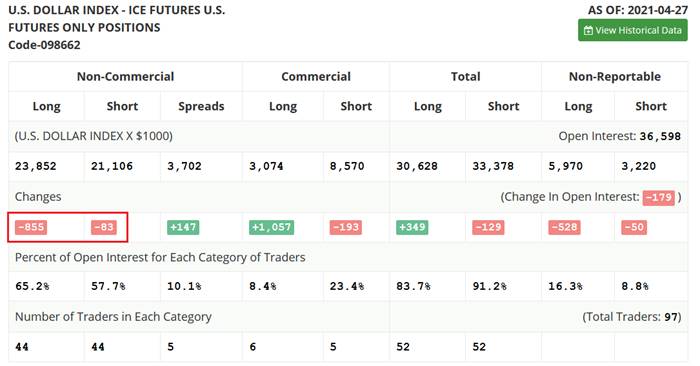
Source:COT
Moreover, with prior periods of extremepessimism followed by monumental rallies in the USD Index, unless ‘this time isdifferent,’ it’s simply a matter of when, not if, the U.S. dollar feasts on theprecious metals’ overconfidence.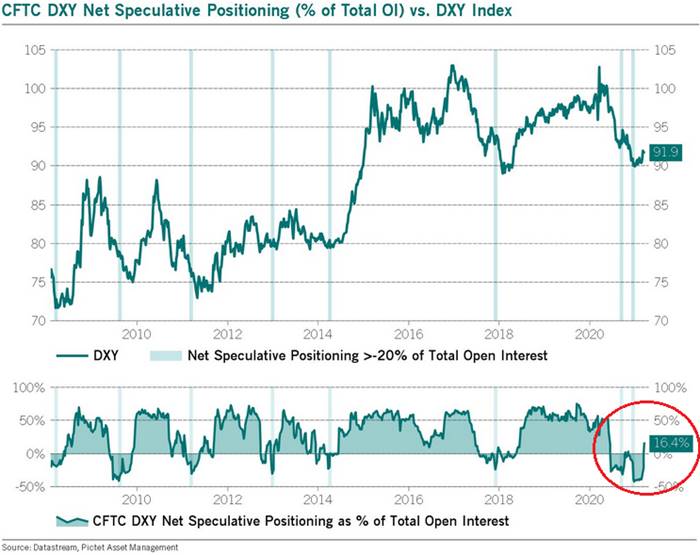
To explain, I wrote previously:
Whennet-speculative short interest as a percentage of total open interest (based onthe CoT data) became extremely high in 2014 and 2018, the USD Index recodedtwo of its sharpest rallies in history. How sharp? Well, let’s take a look athow things developed in the past – after all, history tends to rhyme.
Let’sfocus on what happened when the net speculative positions weresignificantly(!) negative and then they became significantly (!) positive, withoutpaying attention to any tiny moves (like the one that we saw last summer).
Inshort, rallies that followed periods of extreme pessimism include:
Thecurrent rally started at about 89, so if the “normal” (the above shows what isthe normal course of action) happens, the USD Index is likely to rally to atleast 94, but since the 5-index point rally seems to be the data outlier, itmight be better to base the target on the remaining 5 cases. Consequently, onecould expect the USD Index to rally by at least 11 – 20 index points, based onthe net speculative positions alone. This means the upside target area of about105 – 114. Consequently, a comeback to the 2020 highsis not only very likely, but also the conservative scenario.
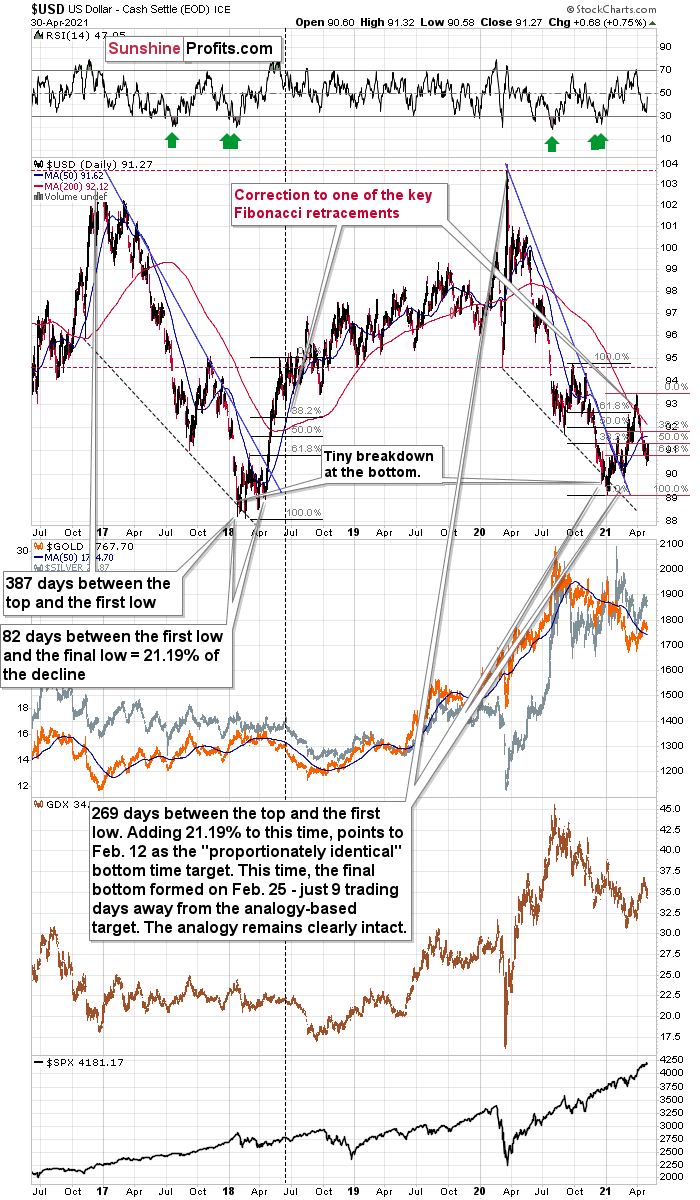
In addition, let’s keep in mind that thevery bullish analogy to the 2018 rally remains intact. If you analyze the chart below, you can seethat back in 2018, the USD Index rallied sharply and then corrected back to(roughly) the 38.2% Fibonacci retracement level. And while the current declineis of a much larger magnitude than what we saw in mid-April 2018, the USD Indexis still following its June 2018 analogue by declining slightly below anothercritical Fibonacci retracement – the 61.8% one. Moreover, amid the greenback’ssurge on Apr. 30 – which I warned was forthcoming – the USD Index invalidatedits breakdown below the 61.8% Fibonacci retracement level. The bottom line? Thesharp reversal is extremely bullish for the U.S. dollar.
More importantly, though, when the USDIndex resumed its uptrend in June 2018 – marked by the vertical dashed linenear the middle of the chart – the measured move higher also coincided with anaccelerated drawdown of gold , silver and mining stocks.
Please see below:
To explain, I wrote on Apr. 21:
Imarked the situation from 2018 that seems similar to what we see right now witha dashed, horizontal line. Back in 2018, the pullback ended when the USD Indexmoved to its first Fibonacci classic retracement level (the 38.2% one). In caseof the current rally, it seems that another classic retracement worked – the61.8% one.
Thevery important detail about the June 2018 decline (and bottom) is that whilethis was the moment after which the USD Index’s started to move higher at aslower pace, it was also the moment after which the precious metals marketstarted to decline faster.
Atthe beginning of the year, I wrote that the precious metals market was likelyto decline and that the preceding rally was likely fake. That’s exactly whathappened.
Rightnow, I’m writing that the recent rally was also fake (a correction within amedium-term decline) and – even more importantly – it seems likely that thenext downswing could take place at a higher pace than what we saw so far thisyear. And – just as was the case in 2018 – this upcoming (fast) decline islikely to lead to the final bottom in the preciousmetals sector.
As further evidence, I warned onApr. 30 that the USD Index was ripe for a reversal. And while entering longpositions in the USD Index is an appetizing thought, shorting the gold minersoffers much more bang for our buck.
I wrote (with regard to possible longpositions in the USD Index futures):
Iwould be looking to re-enter long positions as soon as the USD Index confirmsthe breakout above the declining resistance line. At the moment of writingthese words, the USDX is already trading back above this line, so the onlything that it needs to do now is to stay there. Still, given today’s pre-marketmovement, it seems that we might even see an invalidation of the move below the61.8% Fibonacci retracement. A weekly close above both levelswould be very bullish for the short term and a sign for me to get back to thelong positions .
But– that is all based on the assumption that I would want to have any position inthe USDX. And I don’t because I think that having a short position in miningstocks provides a much better risk-to-reward ratio.
That’s exactly what we saw – a weeklyclose above both levels.
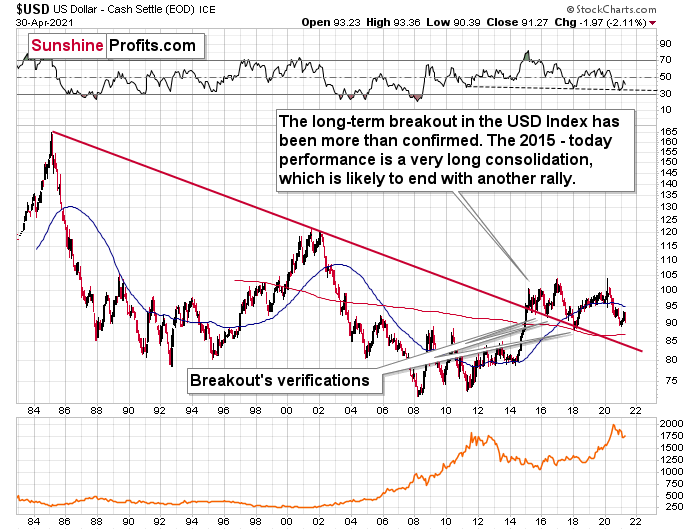
Adding even more ferocity to the USDIndex’s roar, the recent downtrend hasnot invalidated its long-term breakout. And with the long-term implicationstaking precedence over the medium- and short-term ones, the USDX’s uptrendremains intact.
Please see below:
The bottom line?
Given the magnitude of the 2017-2018upswing , ~94.5 is likely the USDIndex’s first stop. In the months to follow, the USDX will likely exceed 100 atsome point over the medium or long term.
Keep in mind though: we’re not bullish onthe greenback because of the U.S.’ absolute outperformance. It’s because theregion is doing (and likely to do) better than the Eurozone and Japan, and it’sthis relative outperformance thatmatters , not the strength of just one single country or monetary area.After all, the USD Index is a weighted average of currency exchange rates, andthe latter move on a relative basis.
In conclusion, with mischievous marketparticipants nipping and clawing at the USD Index’s mane, it’s only a matter oftime before the greenback strikes back with a vengeance. And while the preciousmetals consider the USD Index’s territory up for grabs, the greenback’s prideis unlikely to stay hidden for much longer. As a result, while gold, silver andmining stocks’ gaze across the grassland, the sun has likely set on theirrecent rallies. However, once the wet season washes away the litany offinancial-market imbalances, the eventual bloom will allow the precious metalsto grow stronger in the long run.
Thank you for reading our free analysistoday. Please note that the above is just a small fraction of today’sall-encompassing Gold & Silver Trading Alert. The latter includes multiplepremium details such as the target for gold that could be reached in the nextfew weeks. If you’d like to read those premium details, we have good news foryou. As soon as you sign up for our free gold newsletter, you’ll get a free7-day no-obligation trial access to our premium Gold & Silver TradingAlerts. It’s really free – sign up today.
Przemyslaw Radomski, CFA
Founder, Editor-in-chief
Toolsfor Effective Gold & Silver Investments - SunshineProfits.com
Tools für EffektivesGold- und Silber-Investment - SunshineProfits.DE
* * * * *
About Sunshine Profits
SunshineProfits enables anyone to forecast market changes with a level of accuracy thatwas once only available to closed-door institutions. It provides free trialaccess to its best investment tools (including lists of best gold stocks and best silver stocks),proprietary gold & silver indicators, buy & sell signals, weekly newsletter, and more. Seeing is believing.
Disclaimer
All essays, research and information found aboverepresent analyses and opinions of Przemyslaw Radomski, CFA and SunshineProfits' associates only. As such, it may prove wrong and be a subject tochange without notice. Opinions and analyses were based on data available toauthors of respective essays at the time of writing. Although the informationprovided above is based on careful research and sources that are believed to beaccurate, Przemyslaw Radomski, CFA and his associates do not guarantee theaccuracy or thoroughness of the data or information reported. The opinionspublished above are neither an offer nor a recommendation to purchase or sell anysecurities. Mr. Radomski is not a Registered Securities Advisor. By readingPrzemyslaw Radomski's, CFA reports you fully agree that he will not be heldresponsible or liable for any decisions you make regarding any informationprovided in these reports. Investing, trading and speculation in any financialmarkets may involve high risk of loss. Przemyslaw Radomski, CFA, SunshineProfits' employees and affiliates as well as members of their families may havea short or long position in any securities, including those mentioned in any ofthe reports or essays, and may make additional purchases and/or sales of thosesecurities without notice.
Przemyslaw Radomski Archive |
© 2005-2019 http://www.MarketOracle.co.uk - The Market Oracle is a FREE Daily Financial Markets Analysis & Forecasting online publication.