Victory Formation Long/Short Portfolio Update - Buy Gold, Oil, And Disney
The model portfolio has performed smartly and positively year-to-date.
The near net-neutral design has shielded returns from the 2018 stock market drop in price.
Gold, oil, and commodity related assets in March-April are driving gains on the long side of the ledger.
Statistically, the portfolio continues to outperform reasonable expectations and forecasted returns.
I have increased the model's gold holdings and purchased Disney shares.
The Wall Street Survivor portfolio has outlined strong outperformance of the overall market and typical mutual fund during the sell-off started in late January. Since my last updated portfolio article in February, hard assets like gold and oil investments have begun to perk up. This example portfolio has held hard assets as a core long idea, late in this economic cycle.
Since its May 5th inception, the hedged low-volatility portfolio design has increased at a rate similar to the 100% long invested total return, including dividends, of +12.9% in the S&P 500 index. The model portfolio gain of +13.1% after expenses works out to nearly +14% annualized if it keeps the same pace over the next month. Considering the average net-neutral and market-neutral design by similarly focused hedge and mutual funds during 2017-2018 has increased at a much slower rate beneath +5% per annum after expenses, this example continues to beat expectations. We would have predicted the portfolio to rise in the +2% to +3% range, before expenses, had all the stock selections mirrored the S&P 500 index gain, factoring in the model's slight net-long weighting since May 2017. Effectively, the "average" position has been performing better than 7% annualized above (longs) or below (shorts) expected returns as measured against the peer S&P 500 index. The really good news is a net-neutral long/short portfolio can move forward in worth, even during a stock market crash, when designed properly.
I added a new long position in the SPDR Gold Trust ETF (GLD) and purchased some Walt Disney (DIS) shares at the end of the day on Friday, April 13th. I will discuss the reasons why I am upping my gold exposure, after a brief explanation for owning Disney long.
Disney Getting Cheap
Disney is one of the largest and most valuable entertainment/media companies in the world. It has generated about $10 billion annually in after-tax profits on $55 billion in revenues the last few years. Weighing (1) Disney's tax rate is dropping from the 30s into the low 20 percent range after Trump's tax reform in 2018, (2) its regular share buyback effect going forward will multiply existing income per share, (3) its selling price increases announced so far this year, and (4) the positive pull a decent global economic backdrop will produce for travel and entertainment spending, Wall Street analyst consensus is calling for EPS of $6.90 in 2018 and $7.50 for 2019. At a projected P/E of just 14x this year and 13x next, Disney appears quite undervalued, all else being equal. Why wouldn't an investor want to own one of the most profitable and diversified entertainment giants with an earnings yield of almost 7% currently, measured against Treasury bills, notes, and bonds yielding less than 3%?

Picture Source: Disney Website
I strongly believe Disney CEO Bob Iger is the premier business leader in America right now. His corporate direction decisions have been of an A+ graded variety, from my perspective. Don't take my word for it. Oprah Winfrey has pleaded he run for President in 2020 for a reason. The share price has risen from under $23 in September 2005 to almost $114 in 2017-2018, since Iger became CEO. The S&P 500 has climbed +115% in price over this span, against an equivalent +335% jump for Disney, at $100 a share today. He's accomplished this abnormal rise in shareholder worth without overly leveraging the balance sheet or witnessing an unsustainable valuation by Wall Street investors. In fact, today's 17x trailing EPS is slightly LOWER than September 2005's 19x!
Iger's steady reinvestment of income and cash flows into accretive capital expenditure projects, the acquisition and integration of like-minded enterprises over time, and regular share buybacks, WITHOUT the addition of leverage, has been masterful. Disney is now the biggest theme park and resort owner in the world, and the largest movie maker on planet earth. The next logical goal for the company is to become "the" leader in the delivery of media/entertainment content through online streaming. I urged Disney to acquire a major ownership interest in Netflix (NFLX), if not make a play for the whole asset, in a Seeking Alpha article posted during late 2016.

Picture Source: Disney Website
The catalyst for even better operating earnings and dramatically higher valuations long-term is coming from the Twenty-First Century Fox (FOXA) (FOX) asset merger announced in late 2017. Purchasing popular entertainment content for equity shares, not cash, positions the new Disney in a variety of positive ways. The accretive ideas of (1) competing directly with Netflix through a majority stake in Hulu after the Fox asset merger, (2) rolling out streaming ESPN content as we speak, (3) building a start date for Disney's library to go online cheaply for consumers in 2019, (4) exploiting the new Fox library to be sold/controlled online, and most importantly (5) growing internet delivery sales for years to come rapidly with bundled partnerships from other content providers wanting access to Disney's streaming audiences, should in aggregate help overall business expansion rates markedly the next 3-5 years.
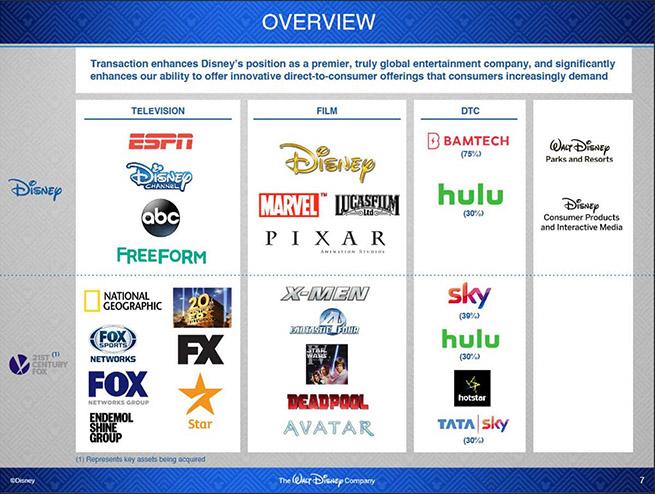
Picture Source: Disney Website
If Disney's online streaming services achieve greater demand from consumers than Netflix or Amazon (AMZN) efforts by late 2019, shouldn't Disney be valued by investors at well above typical S&P 500 fundamental metrics? I am arguing, a best-case scenario, the streaming business model effort could multiply Disney's Wall Street valuation to a 50% to 100% premium against the S&P 500 vs. today's valuation around par to other blue-chips ratios on sales, cash flows, earnings and book value. The S&P 500 stands at 2.2x trailing sales, 12x cash flow, 24x reported earnings, and 3.2x book value. Disney trades at 2.7x sales, 11.5x cash flow, 17x operating earnings, and 3.4x book value.
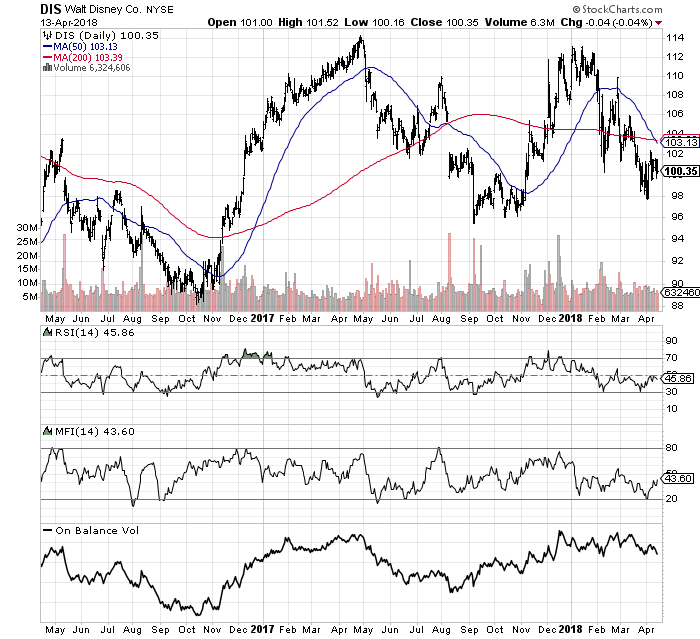
Worst case scenario, I expect Disney to hold up better in a bear market and/or economic recession than past recessions, as it becomes less dependent on theme park attendance and ABC/ESPN television network ad sales after the Fox merger. Regular streaming subscription revenues by 2020 should reduce income volatility year to year. I have noticed better accumulation patterns in its shares since August. The only piece of the puzzle left, from my vantage, is upside momentum in the stock price. As investors realize the accretive valuation and growth story tied to streaming ventures into 2019, I fully expect Disney to morph into a strong outperformance selection against the vast majority of equities. My system is estimating a period of 40-70% outperformance by Disney shares the next 2-3 years vs. the S&P 500 index.
Gold: Time to Buy
I am something of a gold bug. I owned plenty of this precious metal in the early 2000 era when Wall Street called it a dead relic of past generations. Don't tell CNBC or the Wall Street Journal, but gold bars buried in your backyard have earned returns far better than the S&P 500 total return and kept pace with fabled investor Warren Buffett's Berkshire Hathaway (BRK.A) (BRK.B) price change since the 2000 tech bubble peak. Friday's $1347 an ounce price for gold is well above the early 2000 price of $300. Gold's +350% profit over the last 18 years has bested the S&P 500 total return gain of +150% from early 2000, and nearly equaled Berkshire Hathaway's +420% increase. If gold is about to spike higher in value as the stock market succumbs to a bear market tumble, this monetary metal will prove hands down the best buy and hold asset class idea over the previous 20 years.
I believe gold/silver should represent a core 10% to 20% of your financial assets as an uncorrelated hedge against stock and bond market turmoil, and a critical inflation/money printing beneficiary. Believe it or not, gold has risen at a 7% compounded annual rate since 1969, just before the U.S. left a gold standard for dollars in 1970-1971. Out-of-control money printing by the Federal Reserve and huge fiscal deficit spending by Uncle Sam have been mainstays nearly every year since 1970 in America. The present gold price is 38x the official $35 gold conversion price of 1969, roughly 50 years ago. Considering the current sad state of government finances in 2018 and record money printing since the Great Recession of 2007-2009, there is no doubt in my mind gold/silver will rise greater than 7% annually in coming decades.
Why buy gold now? A declining U.S. dollar value, huge geopolitical stresses, an unpredictable U.S. President, the high odds of an overdue equity bear market taking hold, and the latest inversion in gold lease rates are all good reasons to increase your gold holdings in April 2018.
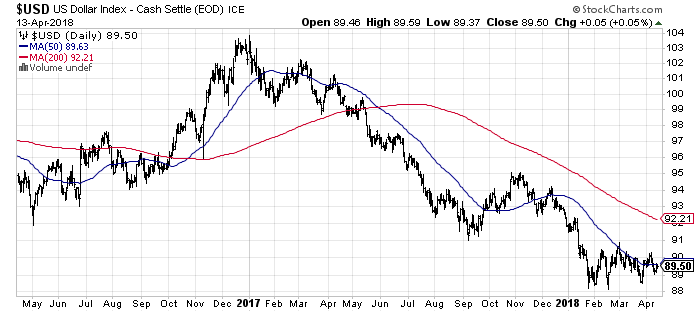
The U.S. dollar spiked right after Trump was elected President in late 2016. However, it has been in real distress mode since the January inauguration date. Because gold is the ultimate form of money (sorry, not U.S. dollars or bitcoins), and has been the standard for pricing every other asset for thousands of years of human history, a depreciating dollar value means gold prices are rising in dollar terms, all else being equal. A weak U.S. dollar is charted below the past several years. As we have witnessed the last few weeks, a confrontation with China over trade, or Russia over Syria could lead to huge precious metals demand for safety-minded investors, and more problems for the dollar's acceptance in the world.
Strong Accumulation Trends and Inverted Gold Lease Rates
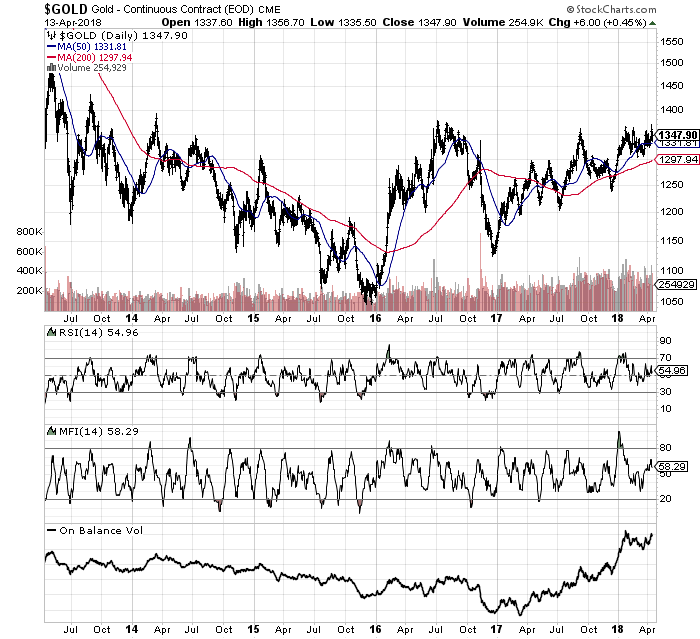
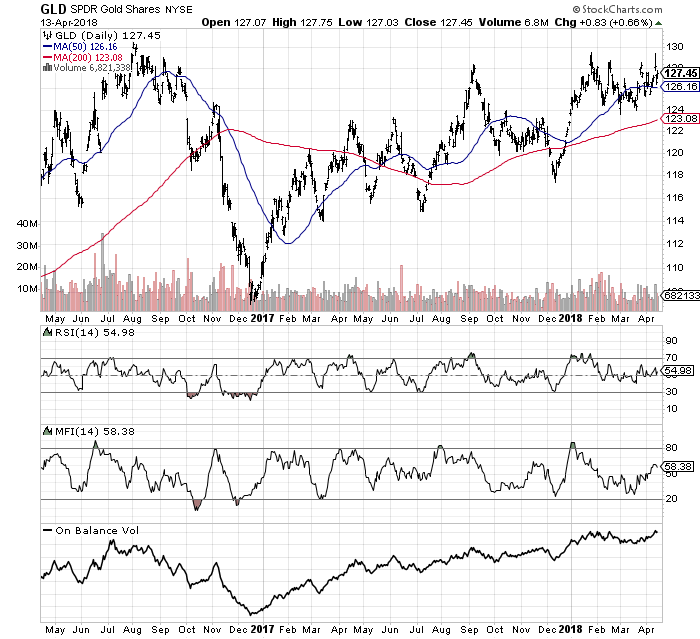
Gold priced in U.S. dollars briefly reached an 18-month high last week. And as the chart below highlights, all we need is another $35 rise in gold to take out its 4-year high! The rising wedge pattern from the low in December 2015 is on the cusp of being broken to the upside. If it is, don't be surprised by another $100 or $200 advance in gold the rest of 2018. Gold bullion, futures and related ETFs have been under accumulation since March 2017. You can view the abnormally strong rise in the daily On Balance Volume [OBV] line below for near futures contracts.
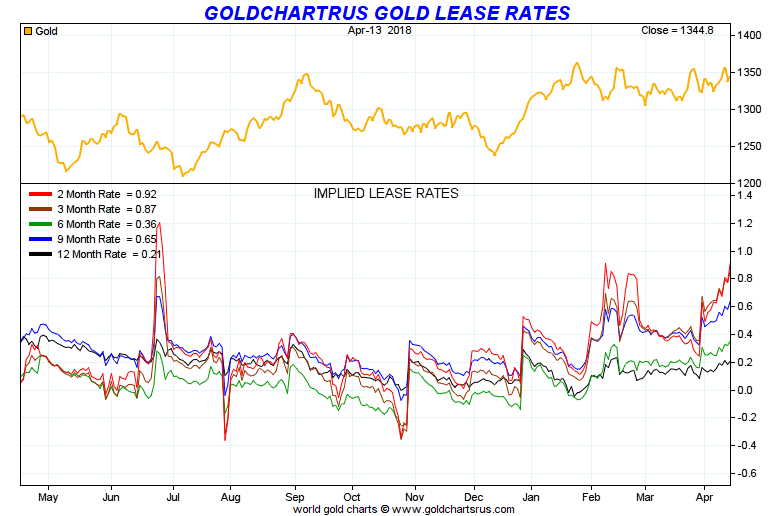
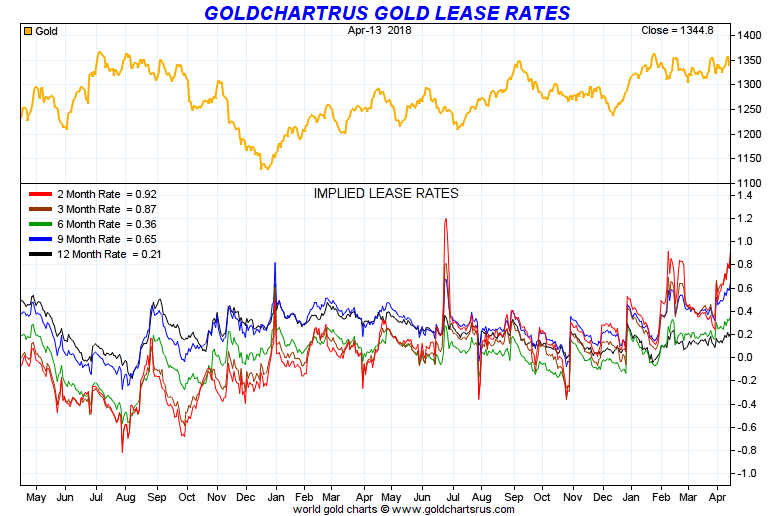
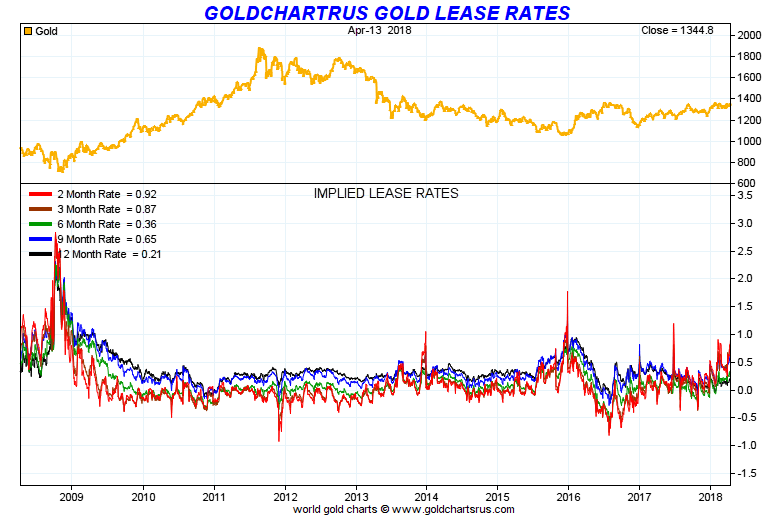
Banks, financial institutions, and large investors buy, sell, hold, and borrow gold, much like other financial assets. Futures contracts, option contracts, various leverage products, forward sales and other exotic money markets trade off the gold price. The basic lease rate curve can highlight tightness in short-term gold supplies. In reality, physical gold shortages have appeared during 2017-18 in the short-term borrowing market, as highlighted by rising and inverted short-term rates vs. longer-term ones. The message: investors are finding it harder to locate short-term gold supplies they can borrow. Pictured below, the red line representing 2-month lease rates has traded above the longer-term 12-month rates at an increasing spread since November. Notice the spike in 2-month rates in June of last year predated a $140 per ounce price gain in gold. Big spikes in lease rates during December 2015 and most of 2008 also forecasted tight bullion markets, leading to sizable gold price jumps. In total, the structure of today's entire lease rate curve is the most bullish for gold since late 2015.
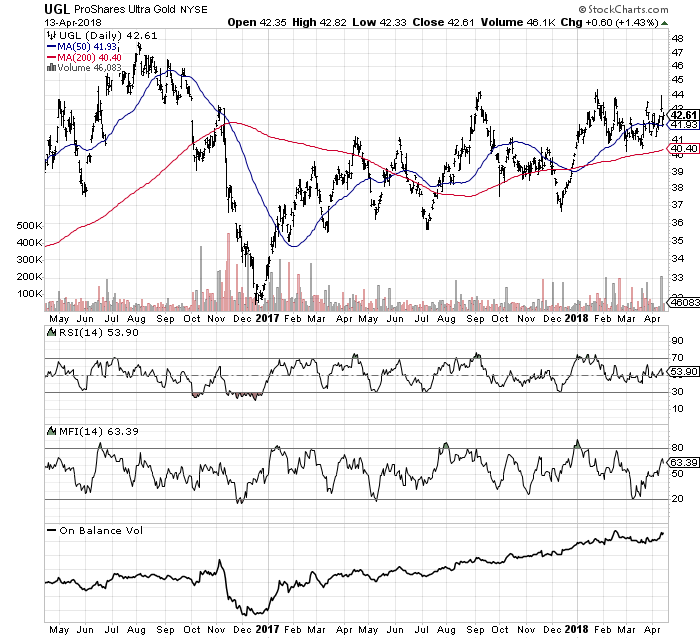
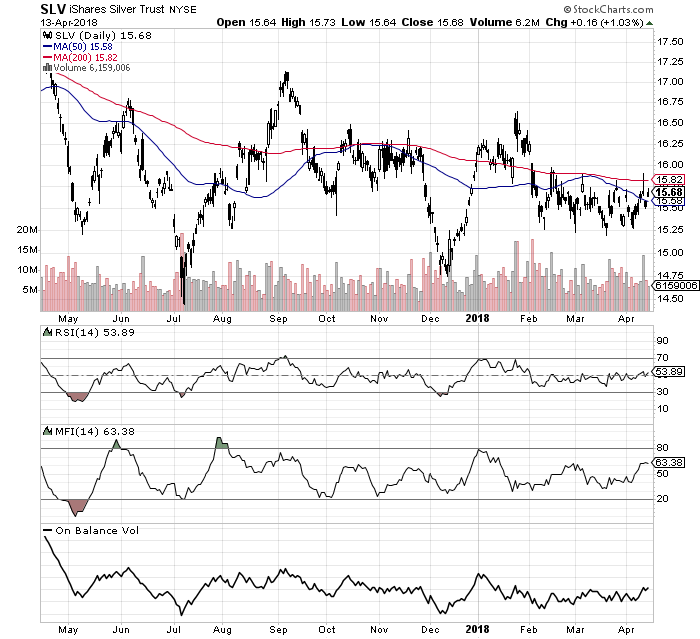
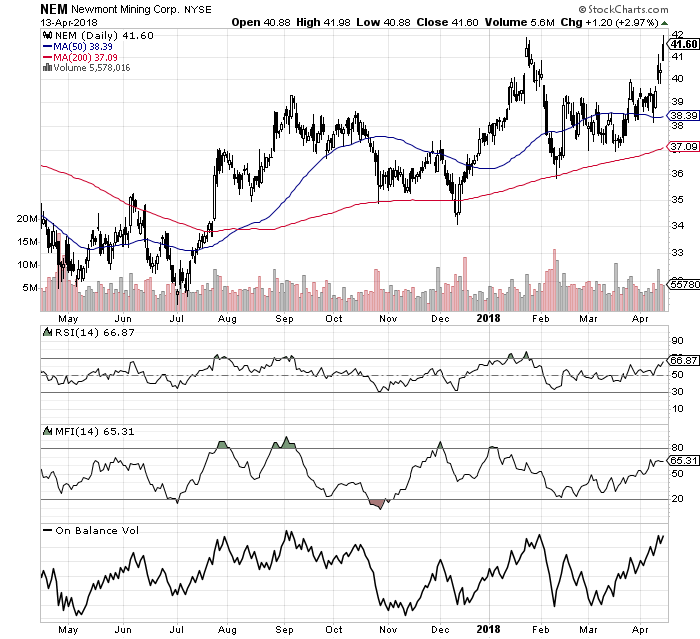
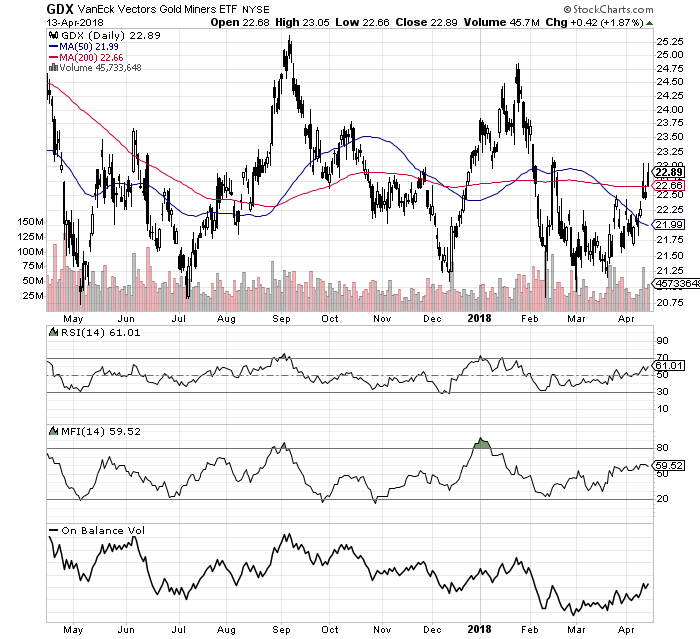
Top Gold/Silver Investments
Below are charts of my favorite gold and silver equity positions included in the model portfolio. I added the new SPDR Gold Trust ETF long position to holdings of ProShares Ultra Gold (UGL), iShares Silver Trust (SLV), the top risk-adjusted miner Newmont Mining (NEM) and the diversified large-cap VanEck Vectors Gold Miners ETF (GDX). I think these positions round out a solid, blue-chip gold and silver stake, easily replicated by small and large investors alike.
Crude Oil: Top Blue-Chips to Own
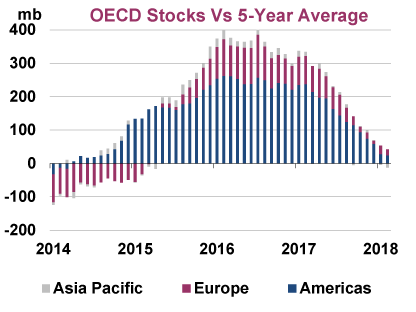
Crude oil fundamentals are pointing to yet higher prices the rest of the year, as OPEC and Russia hold back production. Worldwide inventories continue to fall month after month back toward a normal range, following the oil bust of 2014-2016. Extra political trouble or military adventurism in the Middle East could easily lead to a new shortage situation and $100+ oil per barrel again. Few investors or Wall Street forecasters are ready for such an outcome in 2018-2019, or its wide-ranging economic implications. The International Energy Agency has been reporting demand levels outstripping supply since early 2017. In reality, today's oil inventory totals worldwide have approached normalization.
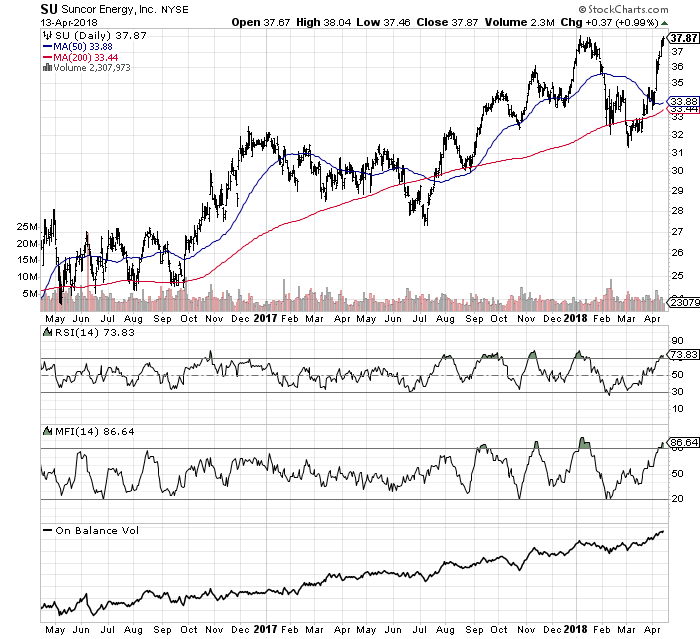
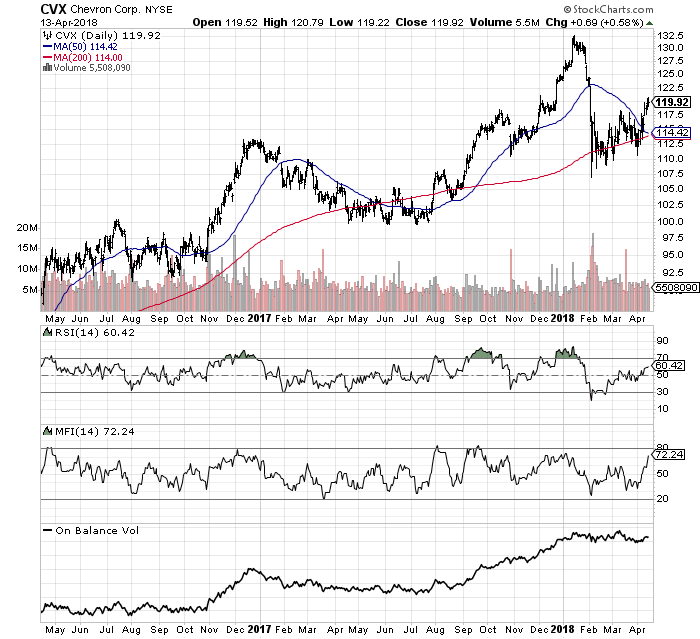
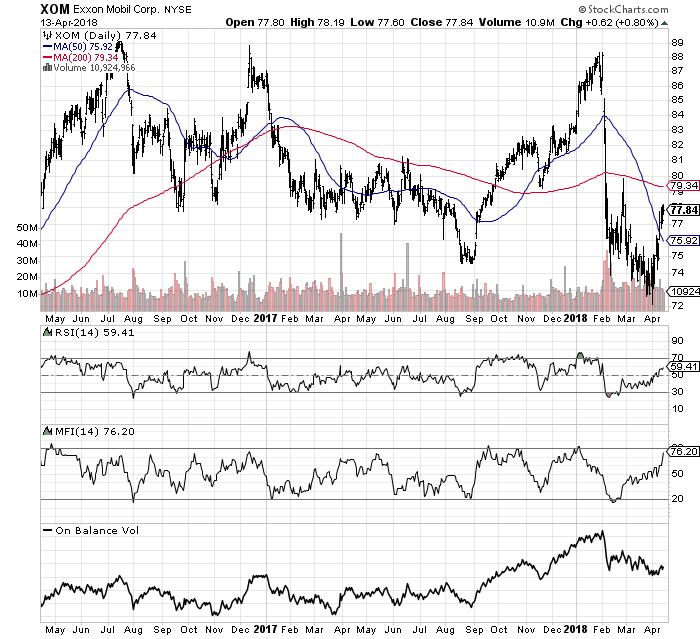
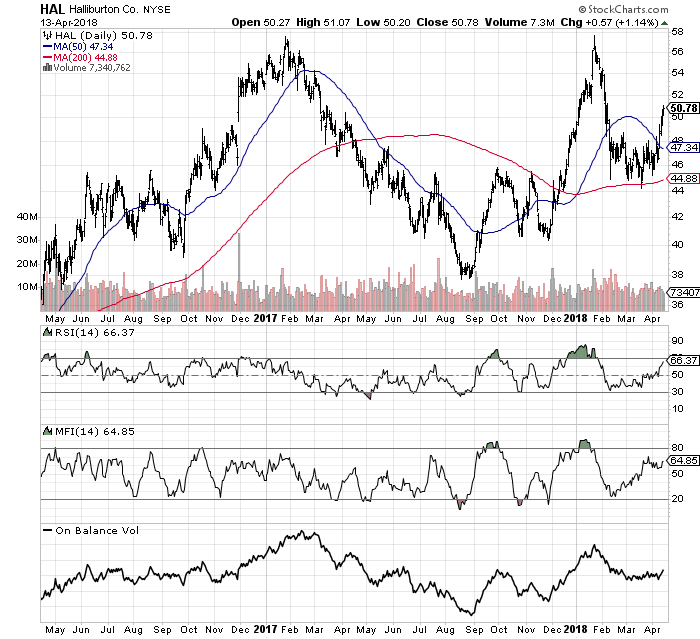
I have been finding some of the best accumulation patterns in hard assets, especially blue-chip oil equities. The model portfolio owns long Suncor Energy (SU), Chevron (CVX), Exxon Mobil (XOM) and Halliburton (HAL). If you want to own diversified, mega-cap oils that have tremendous value under a rising crude oil price scenario, I suggest these as a first step. Using long-term 3- to 5-year Price to Earnings Growth [PEG] forecasts by Wall Street analyst consensus, balance sheet analysis tilted toward "margin of safety" ideas, and strong investor accumulation and/or momentum trends, this is the best group I can find, applying my Victory Formation stock picking system approach. Suncor pays a 3.0% dividend yield on your investment money, Chevron 3.8%, Exxon 4.0% and Halliburton 1.5% as immediate incentives while we wait for higher crude oil quotes.
Other Favorite Hard Asset Plays
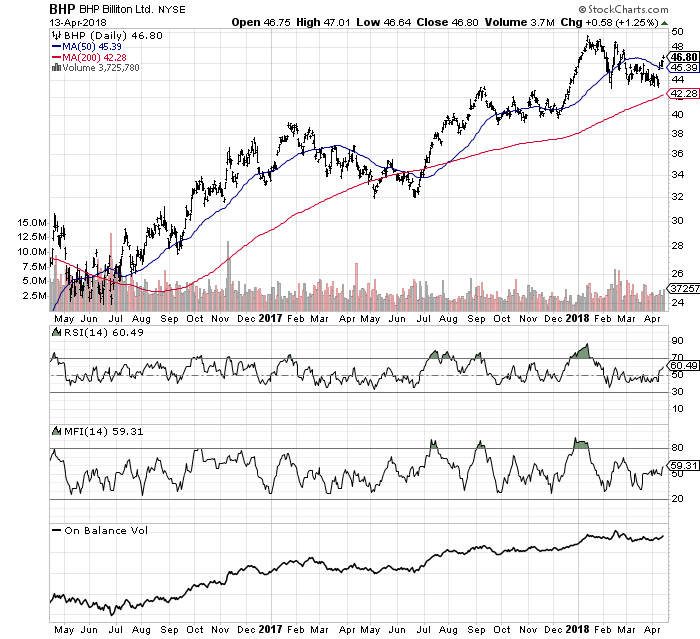
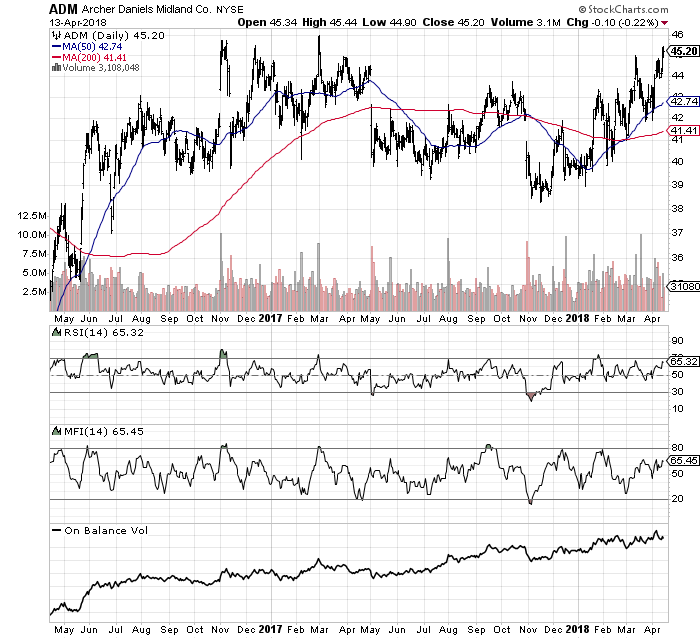
For those wanting to own additional blue-chip hard asset investments, BHP Billiton Limited (BHP) and Archer Daniels Midland (ADM) remain excellent choices. BHP has extensive industrial metals mining and oil production assets, centered in Australia and Asia. Archer Daniels is one of the largest grain refiners and agriculture trading firms in the world, with a majority of its assets located in America. Both have been under heavy accumulation for several years. A lower dollar currency exchange rate, new money printing measures by global central banks (sooner or later) to paper over record debt levels, and steady economic demand for raw commodities should steadily inflate the value of their businesses far into the future. BHP pays a current dividend yield of 4.7% and ADM 3.0% on your invested capital, while you hold for even better stock prices. Bonus!
Portfolio Performance Review
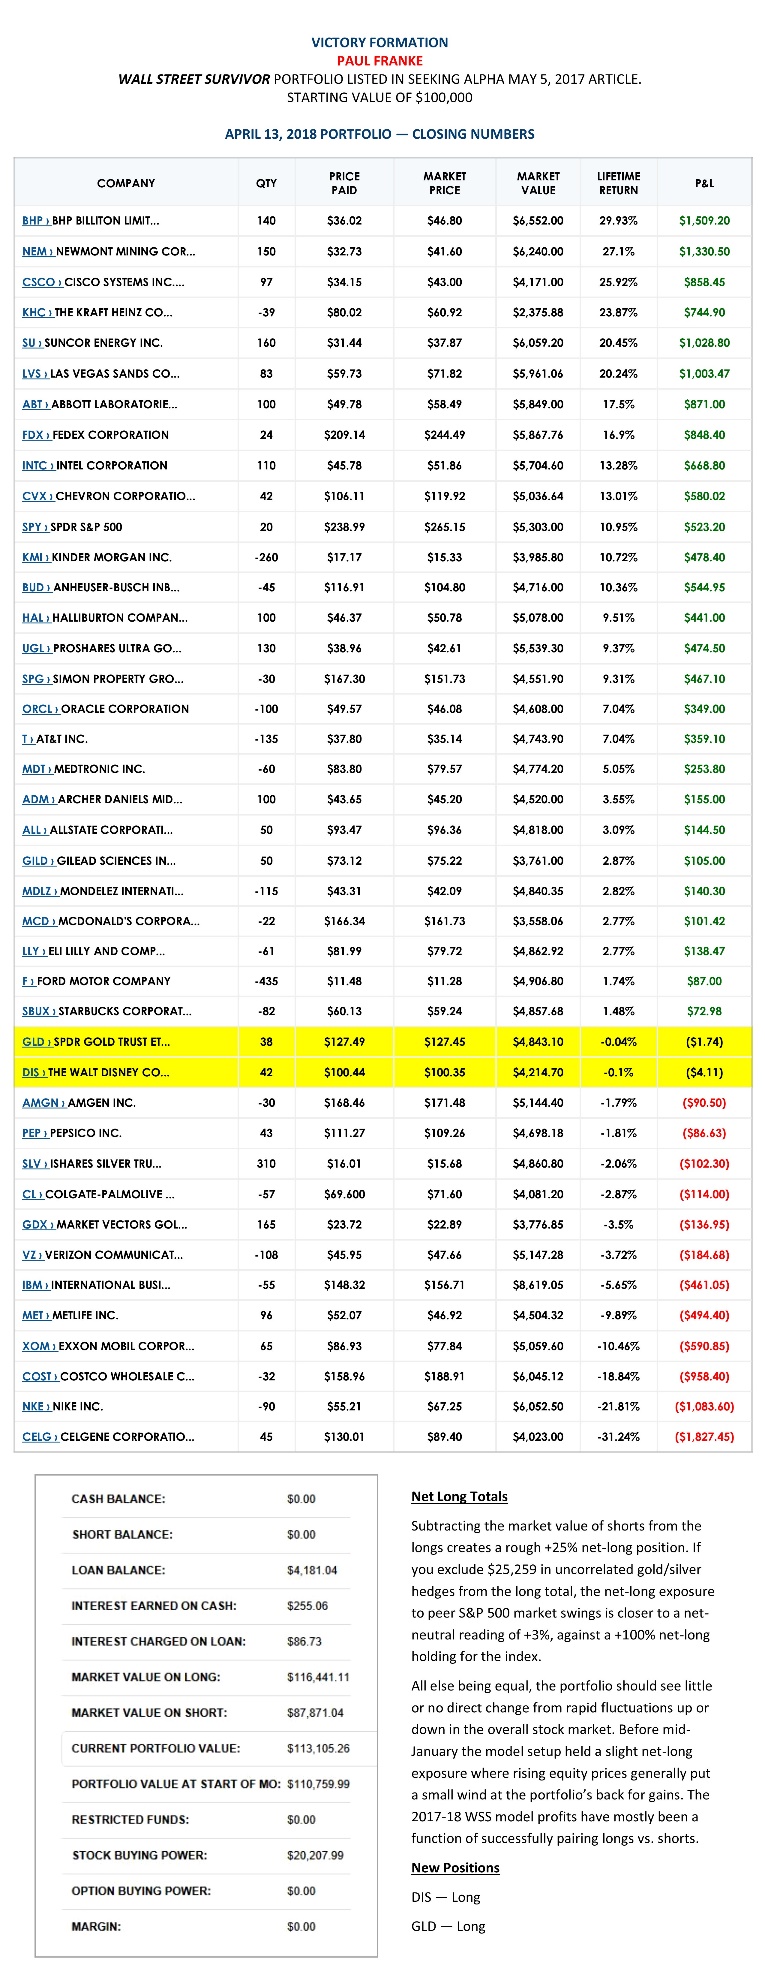
Below is a table of the current WSS model setup, as of the close on Friday, April 13th. The new SPDR Gold ETF and Disney positions are highlighted in yellow. The portfolio is holding 13 winners of greater than +10% vs. four losing positions beyond -10%. Excluding the new purchases, it is holding 27 gainers overall vs. 12 losers, with no particular trend in long or short outcomes. Statistically speaking, the portfolio is performing at a high rate of success, not easily explained by random movements. The Victory Formation system is doing an excellent job identifying stocks for the intermediate-term focused investor. In essence, it is a wonderful independent tool to help investors discover the often searched for, "path of least resistance" in many widely followed blue-chips.
I have suggested considering 20% stop-loss areas for each individual investment. Celgene (CELG), Nike (NKE) and Costco (COST) are near or above the 20% threshold in losses. I am keeping each for different reasons in the portfolio. Celgene is one of the best PEG selections in the S&P 500 currently and has signed 3 major deals the last six months to further its diversified product growth pipeline. Nike's import business model is under attack by President Trump's protectionist push and its valuation is sky-high, in my opinion vs. subpar growth coming down the pike. Costco is very richly priced and quite susceptible to any consumer spending recession. Competition is increasing, especially from Amazon and Walmart (WMT). I think investors in Costco are really playing with fire. I will keep the short position in case a fire erupts, as upside in price seems limited absent a takeover or business combination. Both Nike and Costco are priced on trailing earnings per share near 30, with realistic growth forecasts by Wall Street analysts in the single digits in coming years. If we hit an iceberg, and get an overdue recession, both will see earnings totals move into reverse. How low can they go?
Final Thoughts
The mock portfolio is continuing to perform well during 2018. The portfolio is soundly prepared, on a relative hedged basis, to outgain the S&P 500 if the U.S. stock market sells off or fails to outline strong results from here. Given a further rise by commodity-related assets, including gold and crude oil, in a similar fashion to early April's performance, the model long/short portfolio should drive markedly higher. The portfolio setup is the best risk-adjusted example I can devise for those wanting to prepare for a bear market in financial assets or economic stagnation with rising inflation (stagflation) akin to the 1970s.
Bearing in mind, the 2018 U.S. stock market has reached valuations not seen since the important generational tops of 1929 and 2000, based on CAPE and record price to sales ratios, can you afford not to be lowering equity risk in your investments going forward?
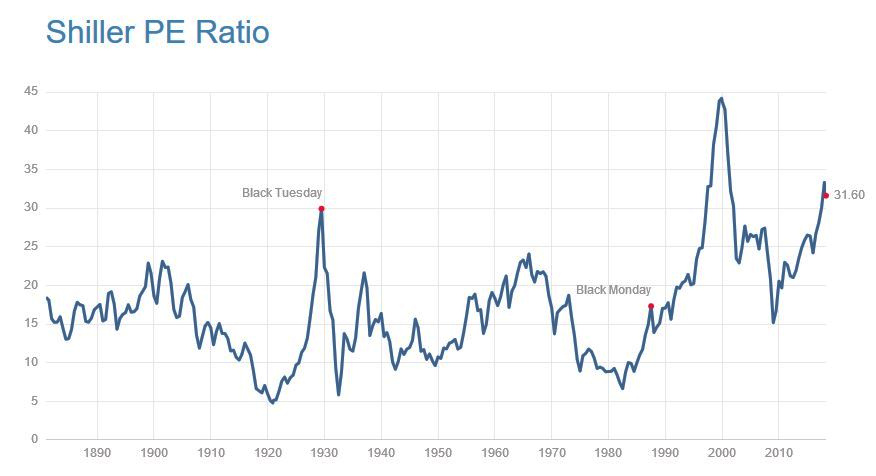
CAPE Chart Source
I have written extensively on all the stocks in the model portfolio in past Seeking Alpha articles. Please feel free to read about individual company setups, in the deeper dive posts I have penned the last year and a half. Thanks for reading.
I suggest investors new to short sales consult an experienced and registered investment advisor. Understanding the various risks involved with borrowing shares and holding high levels of open-ended risk are important to making smart short sale decisions. A diversified list of equities is the best way to execute your short ideas. Concentrating your short sale picks on a few selections is not recommended.
Disclosure: I am/we are long XOM, DIS, CVX, NEM, UGL, SLV, GILD, ADM, HAL, PEP, FDX, CELG.
I wrote this article myself, and it expresses my own opinions. I am not receiving compensation for it (other than from Seeking Alpha). I have no business relationship with any company whose stock is mentioned in this article.
Additional disclosure: I am/we are short COST, VZ, NKE, MCD, IBM, AMGN, LLY, T, SPG, MDLZ, KHC, SBUX, BUD, ORCL, KMI, CL.
Follow Paul Franke and get email alerts