What Does the Stock Market Decline Mean for Gold / Commodities / Gold and Silver 2018

 It was a rough week for investors in stocksand stocks of all kinds. The S&P 500 lost 5%. Emerging Markets also lost5%. Gold Stocks, which had weakened before the broader equity market have beenhit hard. They (GDX, GDXJ) also lost 5% last week. The HUI Gold Bugs Index(which excludes royalty companies unlike GDX) lost 7%. After a strong start tothe year, gold stocks have essentially given back all their gains.Nevertheless, we remain extremely optimistic on gold stocks over the next 12-18months as trends in the economy and stock market should begin to support Goldafter the second quarter.
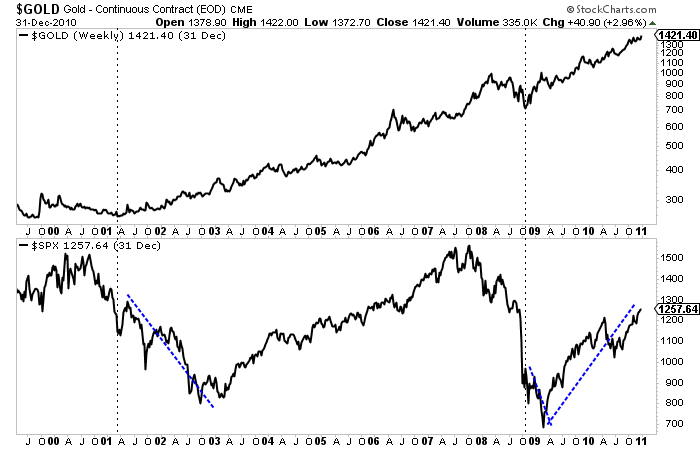
Historically speaking some of the bestperformance in Gold and gold stocks occurred during or after a bear market instocks. The best examples can be found in the 1970s and 2000s as the chartsshow. Gold surged after the bottom in stocks in 1970 and continued to performvery well during the 1973-1974 bear market. After a brief but sharp bear in1975-1976 Gold rebounded strongly as the S&P 500 began a mild bear marketin 1977. Years later Gold emerged from a significant bottom in 2001 while thestock market endured its worst bear market in a quarter century. Gold continuedto perform even after the market bottom in late 2002. Gold emerged from theglobal financial crisis before the stock market but continued to make new highsafter the stock market bottomed in March 2009.
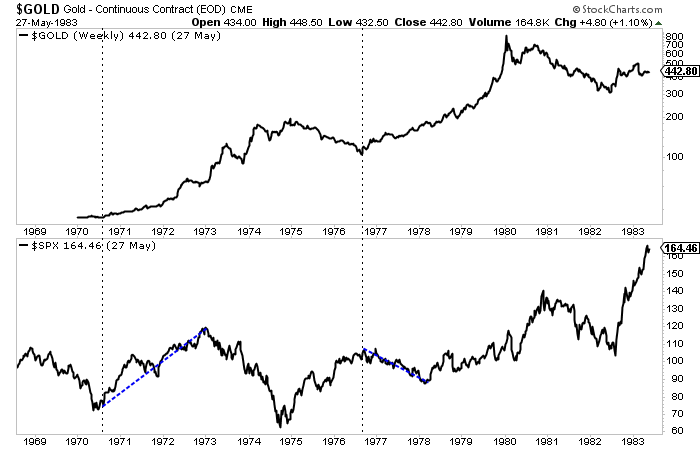
This performance is not just random. It makesquite a bit of fundamental sense. As we know, Gold is driven by falling ornegative real rates. Typically policy makers in response to a recession or bearmarket will pursue policies that lead to falling or negative real rates. Thesepolicies are not reversed until the economy gains strength. Gold can alsobenefit from inflationary recessions, which we saw in the 1970s. Perhaps we areheaded for that outcome at somepoint but I digress.
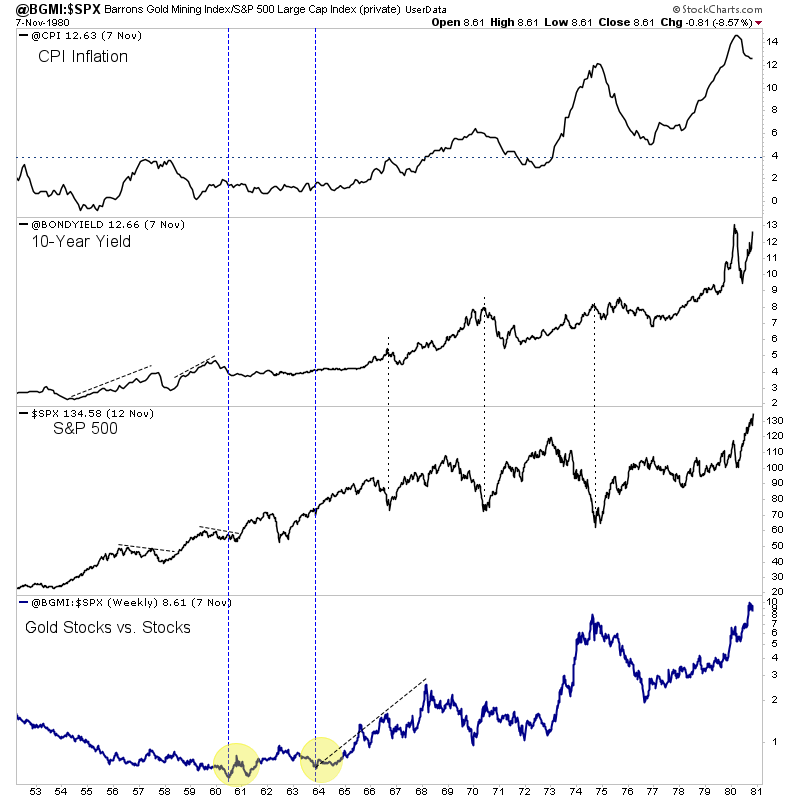
The best comparison to today may be the mid1960s. Although the Gold price was fixed until 1971, we can use gold stocks tostudy the macro picture of the 1960s and how it may relate to today.
Gold stocks and the stock market werepositively correlated during the 1960s but gold stocks dramaticallyoutperformed and especially from 1964 to 1968. That outperformance acceleratedafter 1963 as inflation and bond yields began to rise to higher and higherlevels in the years ahead. That would soon negatively impact the stock marketin both nominal and real terms. The Dow peaked in 1966 while the S&P 500did not peak until 1973 (as it made marginal new highs in 1969 and 1973). Inreal terms stocks would peak in 1966 or 1968 (depending on which index youuse).
Economic fundamentals appear to be headed in adirection that is bullish for Gold and gold stocks and less positive for thestock market. While inflation has yet to be unleashed, the markets are showingthat inflationary pressures are forming. This will impact corporate margins(which are extremely high) as well as profits. Higher inflation also leads tohigher bond yields which means higher costs to service debt. That is a problemfor the economy and equity market due to the debts that have piled up in recentyears.
So the question now is where is the thresholdfor when inflation and bond yields start affecting the economy and stock marketin a way that is favorable for precious metals?
With respect to the 1960s and 1970s, theanswer would be 1964.
When precious metals begin and sustainoutperformance against the stock market it will signal that the threshold orinflection point has been reached. That outperformance will also go a long wayin helping Gold make its major breakout.
It is not yet time for Gold and gold stocks to shinebut it is getting very close. Gold remains in a bullish consolidation patternthat should give way to a breakout later in the year. Meanwhile, gold stocksand Silver are lagging badly but that does not have us concerned. The next fewmonths could prove to be the best buying opportunity in precious metals sincethe end of 2015. Quality juniors that are bought on weakness over the mediumterm should deliver fantastic returns over the ensuing 12 to 18 months.
Good Luck!
Bio: Jordan Roy-Byrne, CMT is a Chartered Market Technician, a member of the Market Technicians Association and from 2010-2014 an official contributor to the CME Group, the largest futures exchange in the world. He is the publisher and editor of TheDailyGold Premium, a publication which emphaszies market timing and stock selection for the sophisticated investor. Jordan's work has been featured in CNBC, Barrons, Financial Times Alphaville, and his editorials are regularly published in 321gold, Gold-Eagle, FinancialSense, GoldSeek, Kitco and Yahoo Finance. He is quoted regularly in Barrons. Jordan was a speaker at PDAC 2012, the largest mining conference in the world.
Jordan Roy-Byrne Archive |
© 2005-2018 http://www.MarketOracle.co.uk - The Market Oracle is a FREE Daily Financial Markets Analysis & Forecasting online publication.