What Happens To The Global Economy If the Oil Price Collapses Below $40 / Commodities / Crude Oil

 Currently, commodity prices are the cheapest they’ve been in over 40 years compared to equity prices. US Equities have continued to rise over the past 7+ years due to a number of external processes. QE1, 2, 3, and Fed Debt Purchases Share Buy-Backs and creative credit facilities. Only recently have investors really started to pile into the US stock market (see charts below). Global investors were very cautious throughout the rally from 2011 to 2016. In fact, the amount of capital invested within the US money market accounts was relatively flat throughout that entire time.
It was only after the 2016 US presidentialelection that investors really began to have confidence in the global economyand started piling into the US stock market and money market accounts. This was also after the time that Oil beganto collapse (2014~16) as well as the deflation of Emerging Markets rallies. With all this new money having entered theglobal markets and equities being extremely overbought currently, what wouldhappen is Oil collapsed below $40 and the global economic outlook soured headedinto the 2020 US presidential election?
On July 10, 2019, we authored a research article using our ADL predictive modeling for Oil. At that time, we predicted Oil would fall in August, recover in September and October, then collapse to near $42 (or lower) in November and December. You can read our followup to this article here.
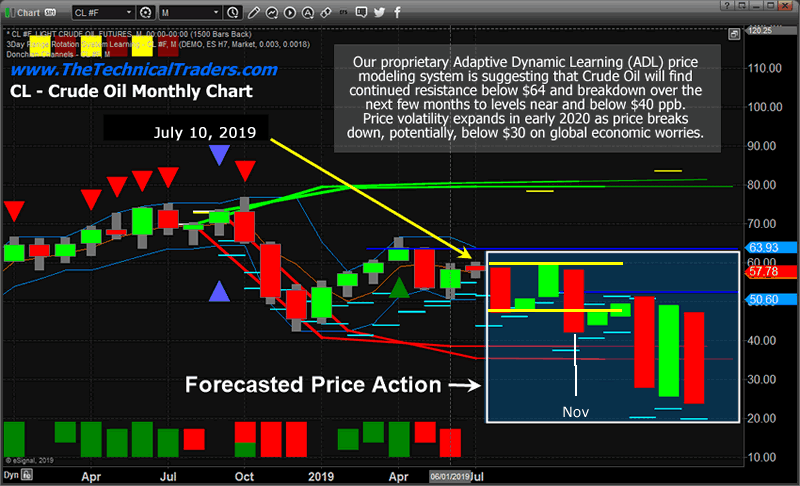
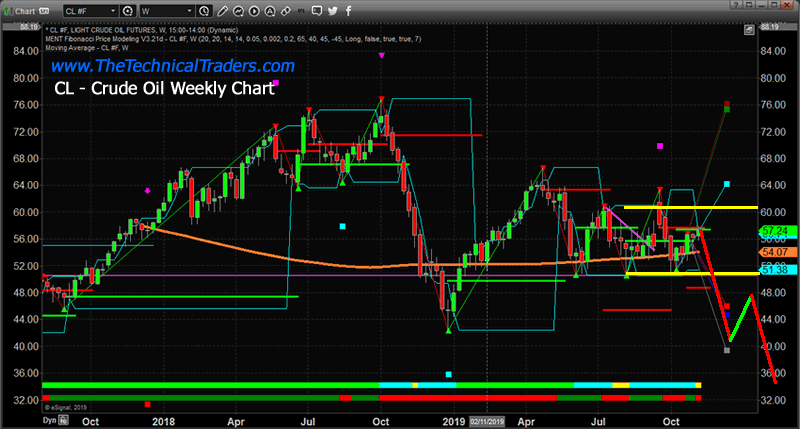
Currently, Oil has followed our ADL predictive modeling relatively closely over the past few months. Although the attack in Saudi Arabia sent prices skyrocketing in mid-September, Crude price has generally stayed within our expected ranges and has recently settled near $55. If you notice the two GREEN BARS on the chart, above, September and October price expectations suggested price settling near $54 and 59 throughout those two months. Now, with November upon us, the ADL predictive modeling system is suggesting Oil prices will collapse from levels near $58 to levels near $40 – a massive 31% price collapse. In reality, the price could fall below on a deeper price decline event.
This Crude Oil chart highlights what webelieve may happen in Oil over the next few weeks and months – where price maycollapse below $40. Yet, we startedasking another question.. What happensto the global economy if Oil prices collapse below $40 before the end of2019? What happens to the nations thatdepend on exported Oil income and to central bank functions within the economy?
When we start to understand the correlationbetween the price of Oil and the expectations throughout the global market, wemust immediately focus on the income expectations of nations that rely on oilas the main source of income. If our ADLpredictions are correct, Oil will begin to plunge to levels near $40 (possiblybelow $40) over the next 3~4 months. Howwill foreign nations react to this loss of income and who are the mostdependent nations on Oil revenues.
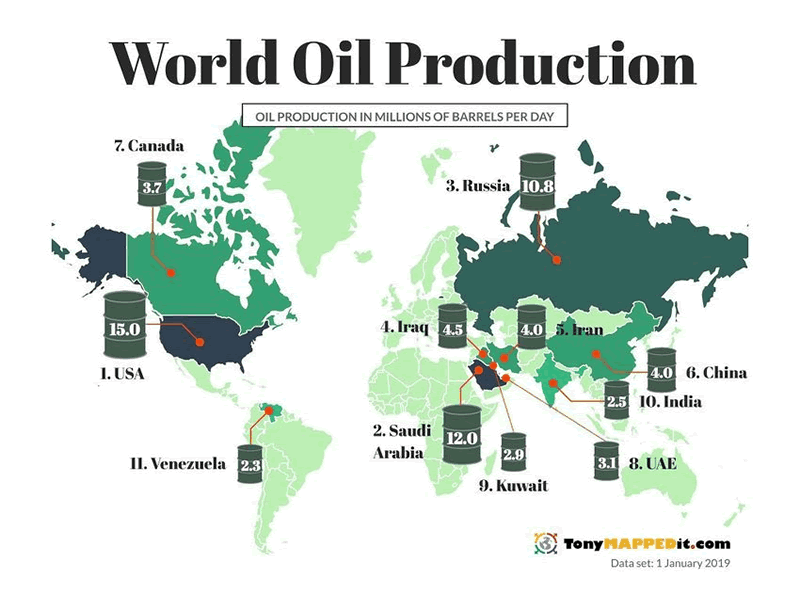
Oil-producing nations vary in scale across the world, yet the United States, Saudi Arabia and Russia are the largest producers. Nations that are the most dependent on Oil revenues are some of the smaller, less mature economies of the world. Should the supply of oil stay relatively consistent across the globe while an extended economic contraction continues, we must begin to question the sustainability of various nations in terms of oil revenues.
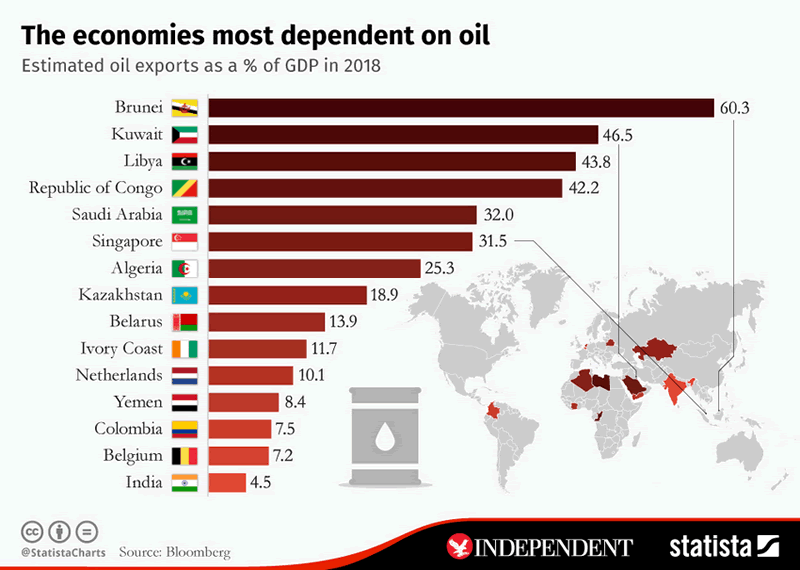
For many of these nations, the income fromOil exports make up more than 15% of their annual GDP – in some cases, withBrunei, Kuwait, Libya, the Republic of Congo, Saudi Arabia and Singapore, oilrevenues make up more than 30% of GDP. How would a dramatic decrease in oil prices act as an economicdestabilization event for these nations? Could they survive the event?
If the price of oil were to fall to $40 fromcurrent levels (near $67), this would represent a 40%+ price decline. Oil revenues for all nations would likelycollapse by similar amounts. Nationsthat are most dependent on oil revenues would be hardest hit and this decreasein national revenue would likely increase strains on future operations,debt/credit as well as potentially create massive social unrest and strife.
If our ADL predictive modeling system is accurate and oil prices collapse to near $40, the economic, social and future strains this creates for many nations become even more severe – at a time when an economic contraction is taking place. This type of commodity price collapse could lead the world into a chaotic economic mess if it is prolonged.
In Part II of this article, we’ll explore the ramifications of this potential oil price collapse across the global stock market and other factors that may be setting up to drive a period of uncertainty and volatility within the global markets.
Opportunities are all around us. Using the right tools to identify the true technical cycles, price cycles, and trading setup can help to eliminate risks and hone into more profitable trades. It is almost impossible to time market tops and bottoms accurately, yet, as you can see from our work above, we have tools that can help us see into the future and help to predict when major price peaks and valleys should form. Using a tool like this to help you determine when the real opportunity exists and when to time your trades will only improve your market insights and trading results….
As a technical analysis and trader since 1997, I have been through a few bull/bear market cycles. I believe I have a good pulse on the market and timing key turning points for both short-term swing trading and long-term investment capital. The opportunities are massive/life-changing if handled properly.
2020 Cycles – The Greatest Opportunity Of Your Lifetime
Chris Vermeulen
www.TheTechnicalTraders.com
Chris Vermeulen has been involvedin the markets since 1997 and is the founder of Technical Traders Ltd. He is an internationally recognized technical analyst, trader,and is the author of the book: 7 Steps to Win With Logic
Through years ofresearch, trading and helping individual traders around the world. He learnedthat many traders have great trading ideas, but they lack one thing, theystruggle to execute trades in a systematic way for consistent results. Chrishelps educate traders with a three-hourvideo course that can change your trading results for the better.
His mission is to help hisclients boost their trading performance while reducing market exposure andportfolio volatility.
He is a regularspeaker on HoweStreet.com, and the FinancialSurvivorNetwork radio shows. Chriswas also featured on the cover of AmalgaTrader Magazine, and contributesarticles to several leading financial hubs like MarketOracle.co.uk
Disclaimer: Nothing in this report should be construed as a solicitation to buy or sell any securities mentioned. Technical Traders Ltd., its owners and the author of this report are not registered broker-dealers or financial advisors. Before investing in any securities, you should consult with your financial advisor and a registered broker-dealer. Never make an investment based solely on what you read in an online or printed report, including this report, especially if the investment involves a small, thinly-traded company that isn’t well known. Technical Traders Ltd. and the author of this report has been paid by Cardiff Energy Corp. In addition, the author owns shares of Cardiff Energy Corp. and would also benefit from volume and price appreciation of its stock. The information provided here within should not be construed as a financial analysis but rather as an advertisement. The author’s views and opinions regarding the companies featured in reports are his own views and are based on information that he has researched independently and has received, which the author assumes to be reliable. Technical Traders Ltd. and the author of this report do not guarantee the accuracy, completeness, or usefulness of any content of this report, nor its fitness for any particular purpose. Lastly, the author does not guarantee that any of the companies mentioned in the reports will perform as expected, and any comparisons made to other companies may not be valid or come into effect.
Chris Vermeulen Archive |
© 2005-2019 http://www.MarketOracle.co.uk - The Market Oracle is a FREE Daily Financial Markets Analysis & Forecasting online publication.