What's Behind the Rising Gold and Treasury Bond Yields / Commodities / Gold and Silver 2018

 Three trends I’ve been forecasting have been happening in thelast year:
They’re all related to late stage inflation and the expected taxcuts, which have materialized.
One thing that still hasn’t happened, and still doesn’t lookimminent yet, is the bursting of this increasingly parabolic stock bubble.
Hard for that to happen when we’ve had the QE free lunch for solong, and now the large tax cuts to corporations.
GDP growth seems to be picking up, but not as much as expected.The fourth quarter reading came in at 2.6% instead of the expected 3.0%-plus.The full 2017 reading was 2.3%, just marginally higher than past years thathave averaged 2%.
Rising growth suggests rising inflation and rising inflationmeans higher T-bond yields, which have already been the case as the chartshows.
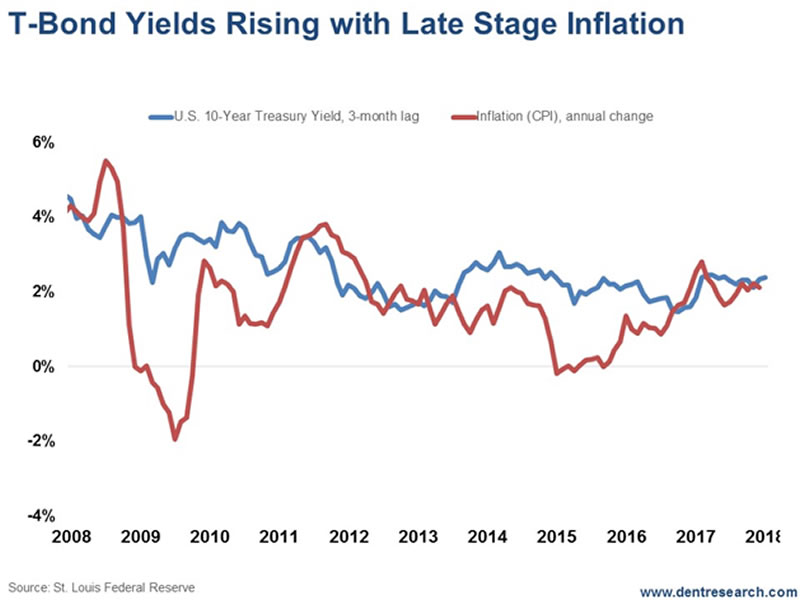
I have also been warning that inflation is alagging indicator.
The last recession saw inflation rise in the first severalmonths – and T-Bond yields with it – before coming down into late 2008/early2009. This is typical and comes from rising wages with tighter laboravailability and rising commodity prices in the late stages of a boom.
On a related note, I’ve been expecting a substantial gold rally– but not a new bull market for the commodity – from the extreme oversoldreaction into the end of 2015, when gold hit $1,050 from an all-time high of$1,934 in September 2011.
Look at this next chart…
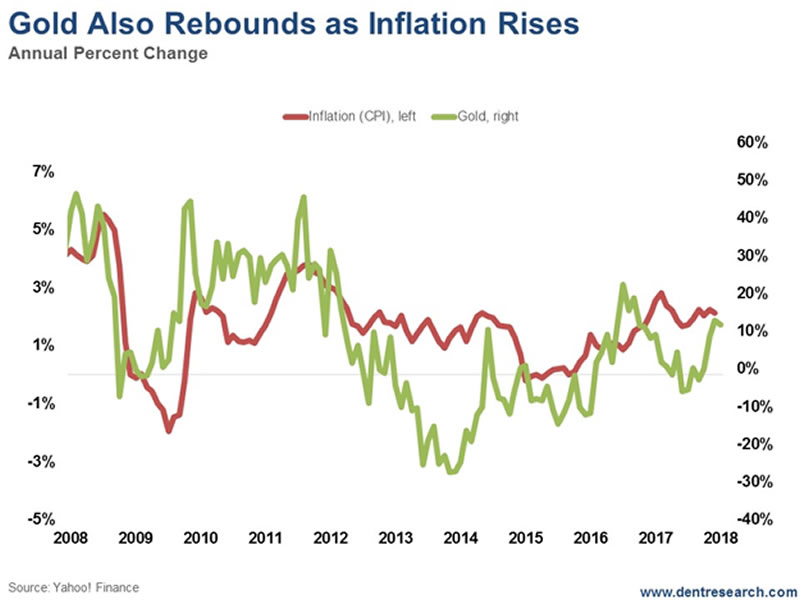
Note that this chart is the annualizedpercentage change in gold to correlate with the percentage rate of inflation.
Gold is more of an inflation hedge, than a crisis hedge.
It crashed 33% in the midst of the Lehman Brothers meltdown,while silver was down 50%.
With this trend of mildly rising inflation, gold prices andT-bond yields will likely continue moving upward until there are signs of aneconomic slowdown and/or a bubble burst in stocks. Then deflation will set in,as occurred briefly in late 2008.
The T-Bond channel I’m watching closely has a strong resistancearound 3.0% yields – which was the previous high in December 2013 – and we aregetting close, at 2.73% on Monday, January 29.
If we break strongly above that, then we are in a new ball gamethat would be very bad for stocks and real estate.
Gold has resistance at the last major high around $1,375, andthe high before that, at around $1,428, is the other strong point ofresistance. That’s the range I’ve been forecasting in the last year or so.
Rising T-Bond Yields aren’t good for stock or real estatevaluations. Will 3.0% start to be that point? We may find out soon enough.
I see 3.0% as the opportunity to buy long-term Treasurys(30-year are the best) to lock in higher yields and play the inevitabledeflation trends ahead when this bubble finally bursts.
And I see the $1,375 to $1,400 area as the opportunity forpeople who didn’t get out of gold in 2011 when we warned to finally take yourmoney and run.
Harry
Follow me on Twitter @HarryDentjr
Harry studied economics in college in the ’70s, but found it vague and inconclusive. He became so disillusioned by the state of the profession that he turned his back on it. Instead, he threw himself into the burgeoning New Science of Finance, which married economic research and market research and encompassed identifying and studying demographic trends, business cycles, consumers’ purchasing power and many, many other trends that empowered him to forecast economic and market changes.
Copyright © 2017 Harry Dent- All Rights Reserved Disclaimer: The above is a matter of opinion provided for general information purposes only and is not intended as investment advice. Information and analysis above are derived from sources and utilising methods believed to be reliable, but we cannot accept responsibility for any losses you may incur as a result of this analysis. Individuals should consult with their personal financial advisors.
© 2005-2018 http://www.MarketOracle.co.uk - The Market Oracle is a FREE Daily Financial Markets Analysis & Forecasting online publication.