Where's The Fed? Watch Precious Metals For Signs Of Inflation Panic / Commodities / Commodities Trading

We recently completed some interesting research related to one of our newest Custom Indexes – the Commodities to Smart Cash Index (C2SC Heat Index) – weighted by the US Dollar and VIX. We’ve been reviewing this new index for months watching it to see how it reacts to various trends in Lumber, Gold, Treasury Yields, the Smart Cash Index, and other weighted values. Recently, we added the Fed Funds Rate to this chart and suddenly things took on a different perspective.
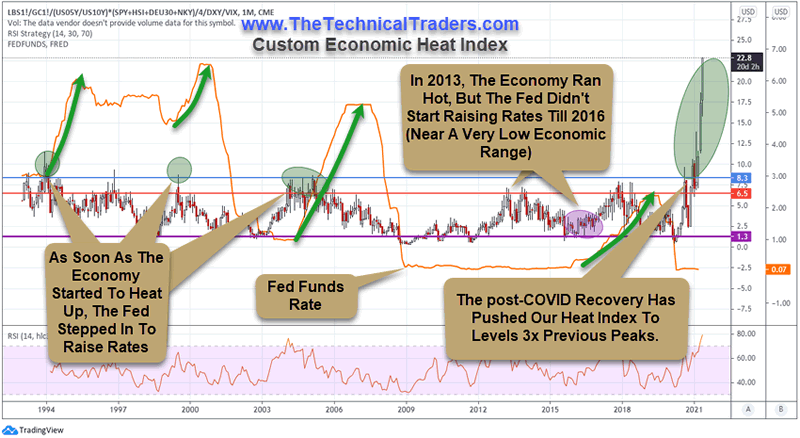
We had drawn horizontal lines on the Commodities to Smart Cash index highlighting historical high, low, and confluence price levels. Historically, when we see a chart that channels in a sideways range, one can often identify high and low price thresholds while also trying to find a confluence level (where a continued rise or decline in price is likely to continue). We can see how the US Fed reacted to rising inflationary concerns almost immediately as the C2SC Index rose near or above 6.5 (the RED Confluence level) throughout the past 25 years. Each time, in 1994, 1999, and 2005, when a period of increasing inflationary trends, the Fed was quick to act to contain inflation. The only time the Fed acted differently was in 2013~2015 and in 2020~now.
Where’s The Fed? Watch Precious Metals For Signs Of Panic
In 2013~2015, the C2SC Index rose above the Confluence level (the RED line) multiple times, yet the Fed kept rates extremely low – ignoring inflationary risks at that time. Then, in 2016, the Fed raised rates very slightly in an effort to test the global market’s reaction to tightening financial policy ahead of a big US election event. By mid-2017, the C2SC index started rising and the US Fed continued to raise interest rates. By late 2017, the C2SC index had risen past the RED Confluence level again and the US Fed continued to raise rates well into early Summer 2018.
In August 2018, the Fed attempted another 0.25% raise that broke the market trend and prompted a broad market decline into December 2018. In reaction to this breakdown in US markets, the US Fed dropped the Fed Funds Rate from 2.5% to 1.5% in a panic move. It stayed at that level until COVID-19 hit in February/March 2020.
Looking at the C2SC index, commodities have rallied more than 300% above the past 25 years of historic highs recently while Yields and Gold/Silver continue to stay rather muted in trends. Our concern is that the US Fed, in an effort to spark a solid post-COVID-19 economic recovery, has ignored the risks related to the extreme excess phase rally taking place throughout the globe in commodities, Cryptos, non-tangible speculative assets (NFTs, digital and others) as well as the risks associated with an eventual raising of interest rates to curb this inflationary excess phase. Gold and Silver have just started what appears to be a new bullish price trend. Will the US Fed be pushed to raise rates soon to curb this incredible bubble rally?
We started bouncing around the idea that the US Fed was inadvertently prompting a South Seas Company type of bubble event by allowing gross amounts of capital into the markets and artificially keeping interest rates near zero. For those of you who don’t know the story of the South Seas Company in London (1720), you can read more about it here: https://www.britannica.com/event/South-Sea-Bubble
FOMO Hyper-inflation Continues (until it ends)
In short, The South Seas Company was awarded £7 million to finance the war against France by the House of Lords. This bill, known as the South Sea Bill, allowed the South Sea Company a monopoly on the trade to South America (mostly Slave trade) and was expected to be a boost to the companies bottom line as the war with France ended with the Treaty of Utrecht (1713). Over the next 5+ years, the South Seas Company enjoyed robust profits and trade. Shares of the South Sea Company rose to 10x their value. Then, the South Seas Company, with King George I of Great Britain as governor of the company in 1781, suggested taking over the national debt of Great Britain in 1720.
Be sure to sign up for our free market trend analysis and signals now so you don’t miss our next special report!
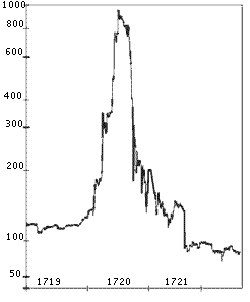
The South Seas Company accomplished this incredible feat and shares started to skyrocket higher from $128.5 to over $1000 in just 7 months. As the hype continued to drive speculation and rumors, other stocks (some newly formed companies) were quick to catch the hype and quickly rallied to extreme highs as false statements, word-of-mouth hype and a general hyperbolic frenzy continued to drive speculation.
What brought down the South Seas Company was unbridled rumors, outright lies, hyperbolic speculation, and, eventually, a flood of money from France’s modernized economy. When the trend finally broke down, it took about 12 months for the entire bubble to deflate – leaving speculative investors holding empty bags.
The rally of the South Seas Company is very similar to what we are seeing right now in the US economy and in digital assets. There were a number of facets in place to drive this type of hyperbolic rally. First, the South Seas Company took over the national debt – essentially acting like the US Federal Reserve for Great Britian. Secondly, the wild speculation related to ongoing business activities and future expectations prompted an over-enthusiastic buying frenzy – driving prices higher by 10x traditional valuation levels.
In the end, with all the speculation, hype and people of title involved, the expected profits and returns from the South Seas Company never really materialized. The stock price started to decline and finally broke downward very sharply near late 1720 – almost 3 months after it peaked.
Is The US Fed Preparing To Make A Move Soon?
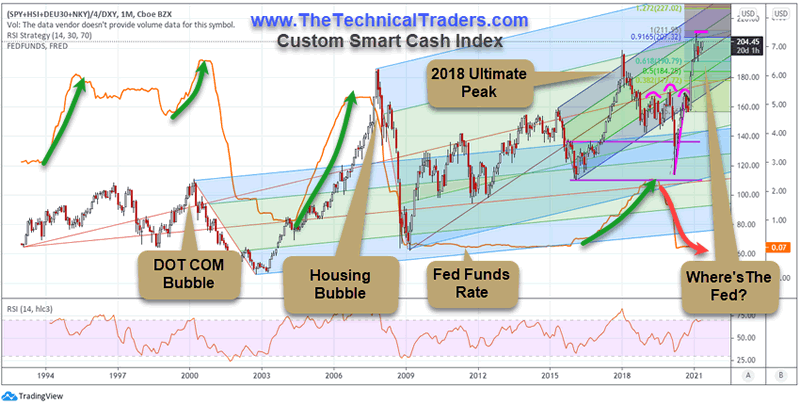
The recent rally in the US stock markets has seemed to stall recently, as can be seen in this Smart Cash Index chart below. Still, the recent rally since the November 2020 elections is nothing short of amazing – very similar to the rally in 2017 and into early 2018 – almost straight up.
Our research team believes a continued market rally may keep attempting to “melt-up” as long as the US Fed does not step in to try to curb inflationary aspects of the markets. It is hard to argue that traders and investors are going to suddenly change their minds in the midst of this FOMO rally – although, it does happen at some point.
There are really two concerns related to how this may end: the US Fed suddenly acting to curb inflation by raising rates and/or the consumers suddenly realizing the valuation levels have exceeded realistic expectations. We feel the rise in commodity prices as well as the current uptrend in precious metals and Copper may be pushing consumers closer and closer to that sudden realization that valuations are grossly advanced in comparison to real expectations.
When you look at this Smart Cash Index Monthly chart, below, you see that the Fed Funds Rate is still anchored near ZERO while the Smart Cash Index is nearing the highest levels since the January 2018 Ultimate Peak. The primary difference is that the US Federal Reserve is not acting to raise rates like they were in 2018 or even just before the Housing Bubble (2005~06). This suggests the rally may continue in a hyper-inflation trend and may push well beyond anyone’s expectations in the near future.
Remember, our C2SC Heat Index is showing the current rally is nearly 300%+ above normal upper ranges. How far will it go? We really don’t know how far this could continue to rally or where the ultimate peak is going to set up. All we can suggest at this point in time is that we’ve entered uncharted waters and we don’t have many historical reference points to use for our analysis. All we can do is ride this trend out using our advanced price modeling systems and watch for signs of a breakdown in support and correlative assets (like Precious Metals, Bonds, Utilities, and the Fed Funds Rate).
If the Fed suddenly starts making moves to address pending inflation, then we may see some big volatility hit the markets. We feel the Fed will slowly move to address inflationary concerns over the next 12+ months – not move in a sudden, aggressive manner.
We need to watch how commodities continue to rally and how consumers react to these inflationary price concerns. If global consumers suddenly shift away from spending as prices continue to rally, then we may start to see a dynamic shift in how the economy continues to expand/recover. Consumers become very protecting of capital/resources when an economy shifts from expansion to contraction.
Either way, there are going to be some really big trends in 2021 and 2022 for traders/investors. This is the type of setup that can make fortunes for skilled traders/investors.
The bigger question is, will you be ready to jump into the strongest sectors when this downside trending ends? Do you know which sectors present the best opportunities for future profits? You can learn more about how I identify and trade the markets by watching my FREE step-by-step guide to finding and trading the best sectors.
For those who believe in the power of trading on relative strength, market cycles, and momentum but don’t have the time to do the research every day then my BAN Trader Pro newsletter service does all the work for you with daily market reports, research, and trade alerts. More frequent or experienced traders have been killing it trading options, ETFs, and stocks using my BAN Hotlist ranking the hottest ETFs, which is updated daily for my premium subscribers.
Chris Vermeulen
www.TheTechnicalTraders.com
Chris Vermeulen has been involvedin the markets since 1997 and is the founder of Technical Traders Ltd. He is an internationally recognized technical analyst, trader,and is the author of the book: 7 Steps to Win With Logic
Through years ofresearch, trading and helping individual traders around the world. He learnedthat many traders have great trading ideas, but they lack one thing, theystruggle to execute trades in a systematic way for consistent results. Chrishelps educate traders with a three-hourvideo course that can change your trading results for the better.
His mission is to help hisclients boost their trading performance while reducing market exposure andportfolio volatility.
He is a regularspeaker on HoweStreet.com, and the FinancialSurvivorNetwork radio shows. Chriswas also featured on the cover of AmalgaTrader Magazine, and contributesarticles to several leading financial hubs like MarketOracle.co.uk
Disclaimer: Nothing in this report should be construed as a solicitation to buy or sell any securities mentioned. Technical Traders Ltd., its owners and the author of this report are not registered broker-dealers or financial advisors. Before investing in any securities, you should consult with your financial advisor and a registered broker-dealer. Never make an investment based solely on what you read in an online or printed report, including this report, especially if the investment involves a small, thinly-traded company that isn’t well known. Technical Traders Ltd. and the author of this report has been paid by Cardiff Energy Corp. In addition, the author owns shares of Cardiff Energy Corp. and would also benefit from volume and price appreciation of its stock. The information provided here within should not be construed as a financial analysis but rather as an advertisement. The author’s views and opinions regarding the companies featured in reports are his own views and are based on information that he has researched independently and has received, which the author assumes to be reliable. Technical Traders Ltd. and the author of this report do not guarantee the accuracy, completeness, or usefulness of any content of this report, nor its fitness for any particular purpose. Lastly, the author does not guarantee that any of the companies mentioned in the reports will perform as expected, and any comparisons made to other companies may not be valid or come into effect.
Chris Vermeulen Archive |
© 2005-2019 http://www.MarketOracle.co.uk - The Market Oracle is a FREE Daily Financial Markets Analysis & Forecasting online publication.