Why I'm Fully Loaded On Barrick Gold
I believe Barrick will increase in value over the next two years even if the price of gold remains flat.
Barrick's current EV/EBITDA ratio is 8.6 and I expect it to decline to 5.7 as EBITDA increases and debt is repaid. Additional interest savings aren't included in this multiple.
The bullish technical setup in GOLD is something that hasn't been seen since the last bull market back in 2000-2011.
Barrick is the best value amongst all of the senior producers, and it will be re-rated higher as the market will start pricing in these improvements.
You don't need to be bullish on gold to be bullish on Barrick Gold (GOLD), there is enough value here to see strong appreciation in the share price just from improving fundamentals alone.
Many investors shun gold stocks because they might be bearish - or indifferent - when it comes to the outlook for physical gold. That's understandable given the perceived notion that a miner's performance is based solely on where metal prices trade. But while mining shares do have a strong correlation to the gold price, at the end of the day, what moves all companies is earnings and cash flow.
There are countless examples of gold stocks that have risen substantially in value during a flat or declining precious metal environment. This is because these companies saw strong fundamental improvements in their respective businesses.
While I believe gold will be increasing in value over the next few years, even if it stays in this ~$1,300 consolidation range that it's been in since 2014, Barrick will prove to be another example of a gold mining stock rising in value despite getting zero help from its end product.
In this article, I will explain why.
EV/EBITDA Multiple Declining + Increased Free Cash Flow From Interest Savings
Using the TTM adjusted EBITDA figures, the current EV/EBITDA ratio is 8.6 for Barrick. If we assume the Q1 adjusted EBITDA is the average per quarter on a go forward basis (which I believe is attainable given the Randgold (OTCPK:RGORF) acquisition), then account for the net debt reduction and savings from the Nevada JV synergies, Barrick will be trading at an EV/EBITDA multiple of 5.7 in roughly two years. That's assuming everything (i.e. the gold price and GOLD share price) stays equal. Since EBITDA doesn't include interest, there are additional interest savings that aren't counted in this multiple. Given my debt reduction forecast, there is ~$200 million of interest that will be saved per annum, which basically goes right to the bottom line.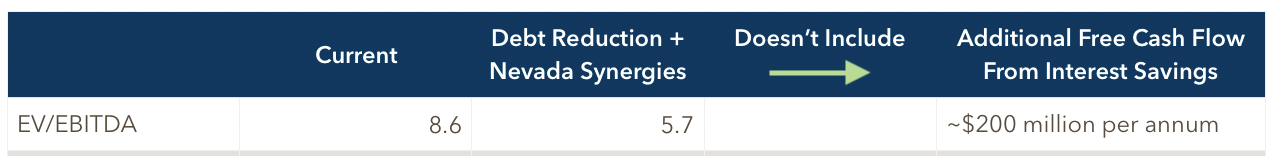
(Source: SomaBull)
Breaking this down further:
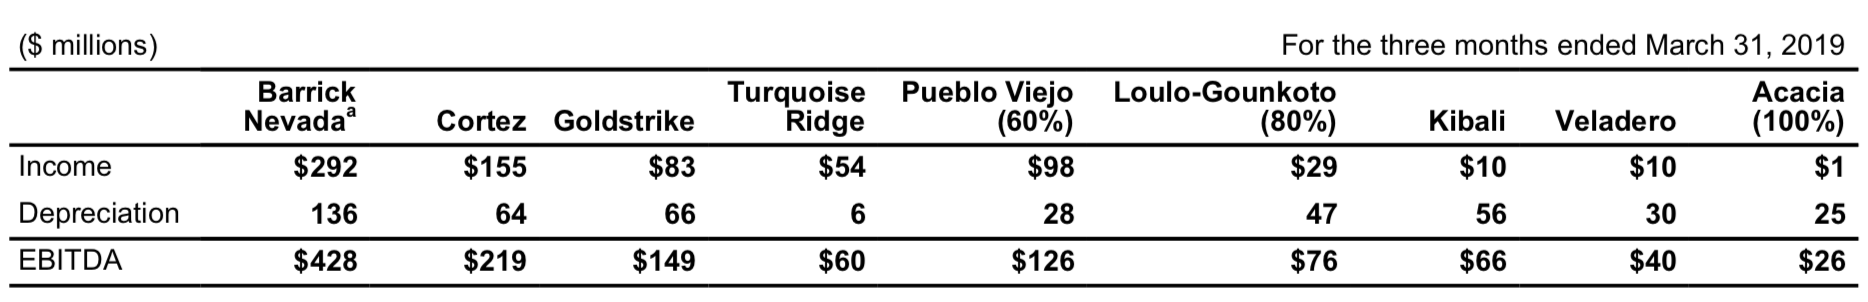
EBITDA Is Increasing And There Will Be Further Improvements Once Nevada Synergies Take Hold
With the Randgold merger now closed, Barrick's production has not only stabilized at just over 5 million ounces of gold, but Q1 figures put the company on track to well exceed the 5.1-5.6 million ounce guidance for the year. Production is also on a steady uptrend as it has increased QoQ for the last four quarters. The Randgold acquisition certainly helped in Q1, but these are clearly conservative projections (AISC came in at $825 in Q1 vs. $870-920 AISC guidance for 2019). This is typical for Barrick.
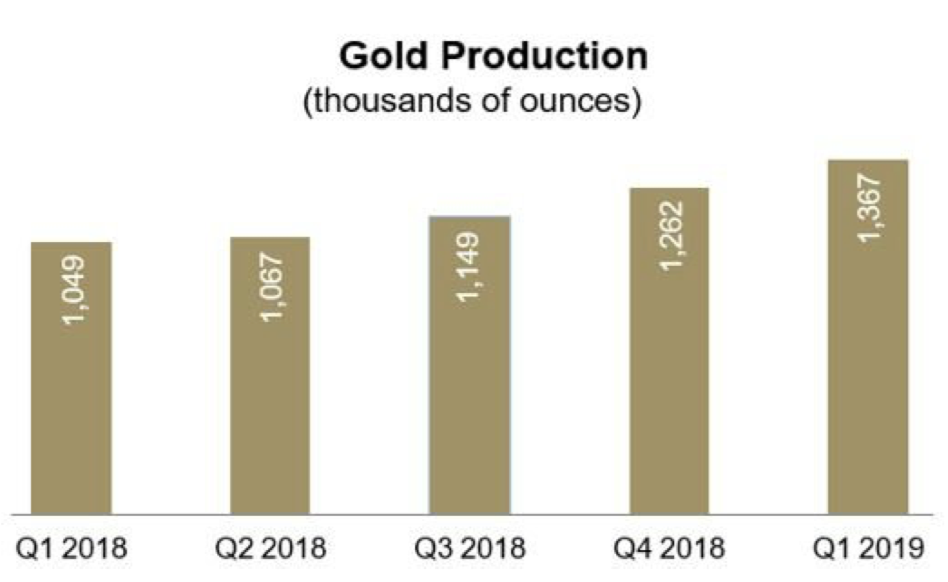
(Source: Barrick Gold)
These better than expected operating metrics are translating into strong financial results - as revenue and EBITDA in Q1 were the highest since 2017 and this was the best Q1 showing in the last four years. On a TTM basis, adjusted EBITDA is $3.2 billion, but that only includes one quarter of results from Randgold and reflects weakness in the price of gold last year. On a go forward basis, adjusted EBITDA should be around ~$1 billion per quarter at current metal prices.
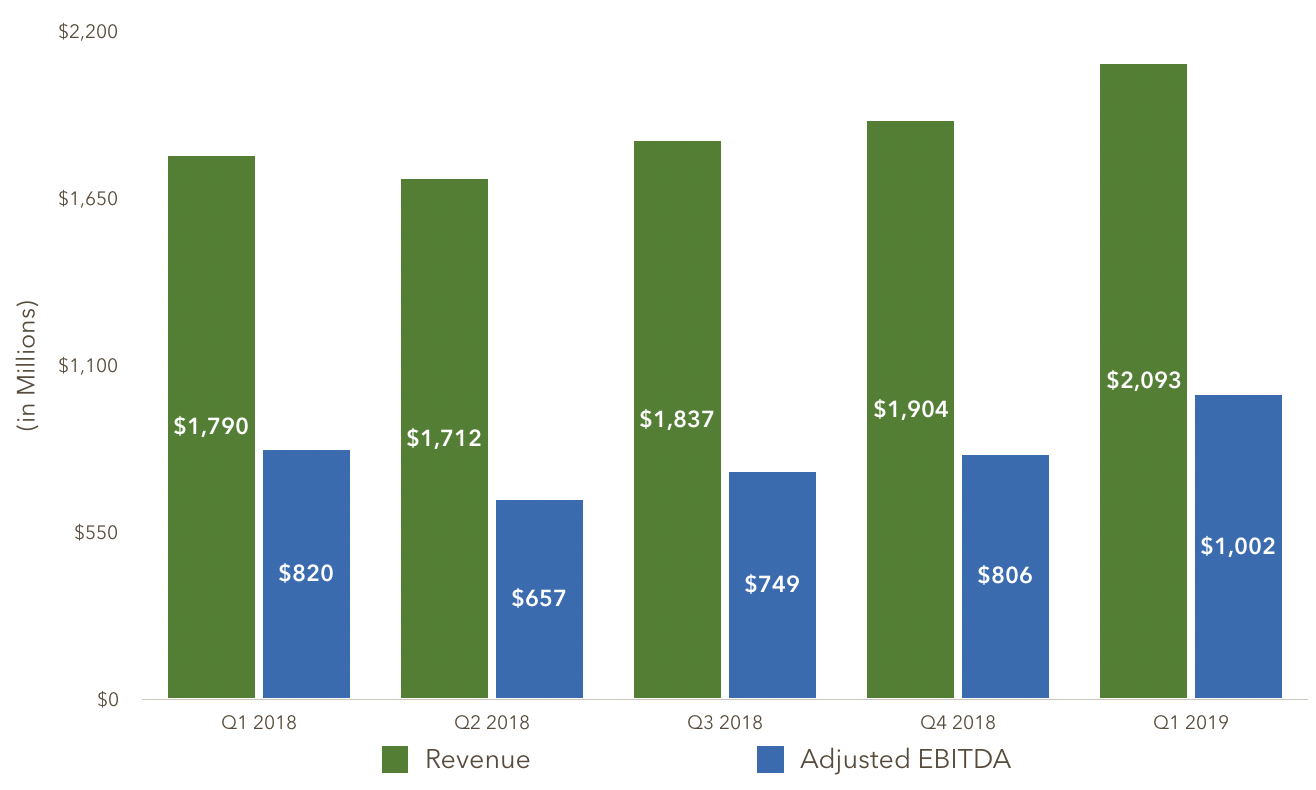
(Source: SomaBull)
That's before taking into account the synergies from the recent Nevada JV with Newmont (NYSE:NEM). The two companies have significant assets in the state, and earlier this year, they finally formed a joint venture to unlock the synergies of these mines and projects. Barrick expects to realize $300 million of pre-tax savings per year for the next 5 years and $215-250 million of pre-tax savings per year for the 7 years that follow.
Once all of these assets are integrated (expected by the end of this quarter), it will result in a further boost to EBITDA for Barrick. At that point, I would estimate the annual run rate for adjusted EBITDA at around $4.3 billion.
Net Debt Reduction
Barrick has sold several assets (mostly non-core) over the years in order to reduce debt. Even though this meant lower production going forward, the value received for these assets was at or above the NAV assigned by the market as Barrick was getting top dollar for its mines. While this strategy reset output, it was worth it as it allowed Barrick to make great strides in reducing its net debt. Free cash flow over the last several years has also helped lower this debt burden.
The graph below shows the progress, as net debt at the close of Q1 2019 was ~30% of the end of 2012 level.
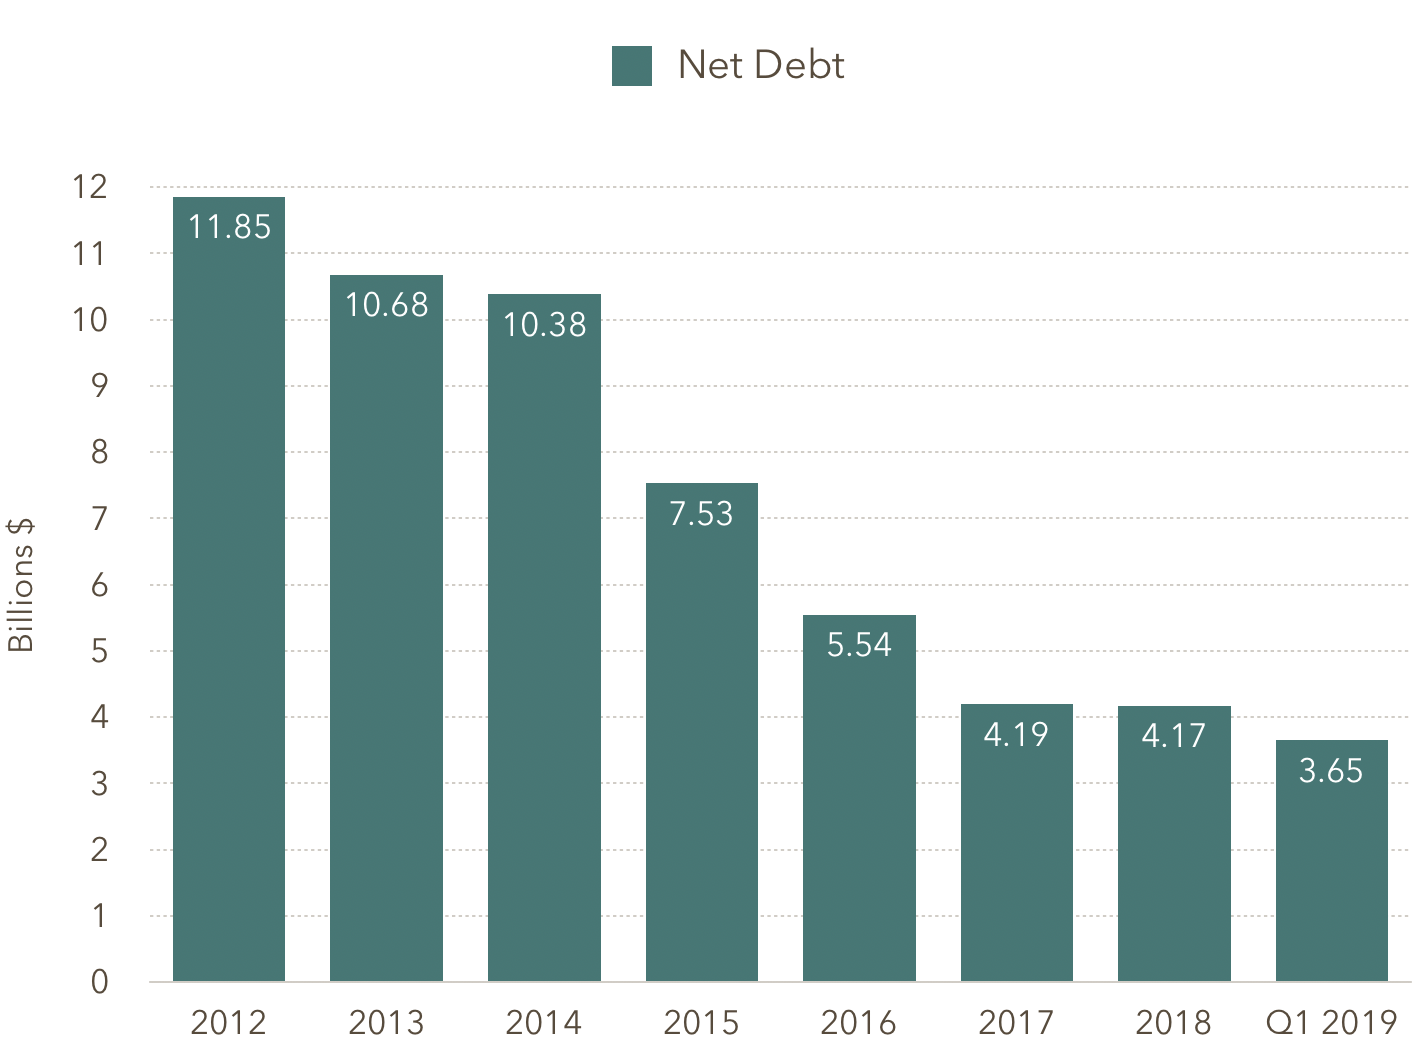
(Source: SomaBull)
Reductions in net debt lower the EV/EBITDA multiple and I expect net debt to continue this progression towards the zero mark over the next 2 years. This will be accomplished via the same two avenues: free cash flow and asset sales.
Barrick has discussed divesting itself of more assets and is rumored to be trying to sell its Lumwana copper mine. There are possibly other non-core gold mines that are also up for sale such as Lagunas Norte and Kalgoorlie. It's unclear what the realized value will be from these divestitures, but estimates are around $1.5 billion. That would bring net debt down to just over $2 billion, and free cash flow over the next 2 years could drive down the remaining net debt balance to $0.
Asset sales will result in lost EBITDA, but the mines Barrick is looking to dispose of aren't significant contributors to earnings, which means the overall loss will be quite modest. For example, Lumwana's AISC was $2.79 per pound of copper in Q1, which was about the average price for copper during the quarter. This operation likely produced little, if any, earnings in Q1. The operations below contribute the bulk of EBITDA. Mines like Hemlo, Lagunas Norte (only $33 million in EBITDA last year), Kalgoorlie, and a few others are much smaller contributors. I have still accounted for this loss of EBITDA in my projected EV/EBITDA multiple above.
(Source: Barrick Gold)
Savings On Interest
One aspect about this debt reduction that needs to be highlighted is the substantial savings in interest that come along with it.
Five years ago, Barrick was projecting $551 million in interest for 2019 as net debt was over $10 billion at the time. As debt has come down, so have those interest payments. In Q1 2016, the interest that was expected to be paid this year dropped to $448 million.
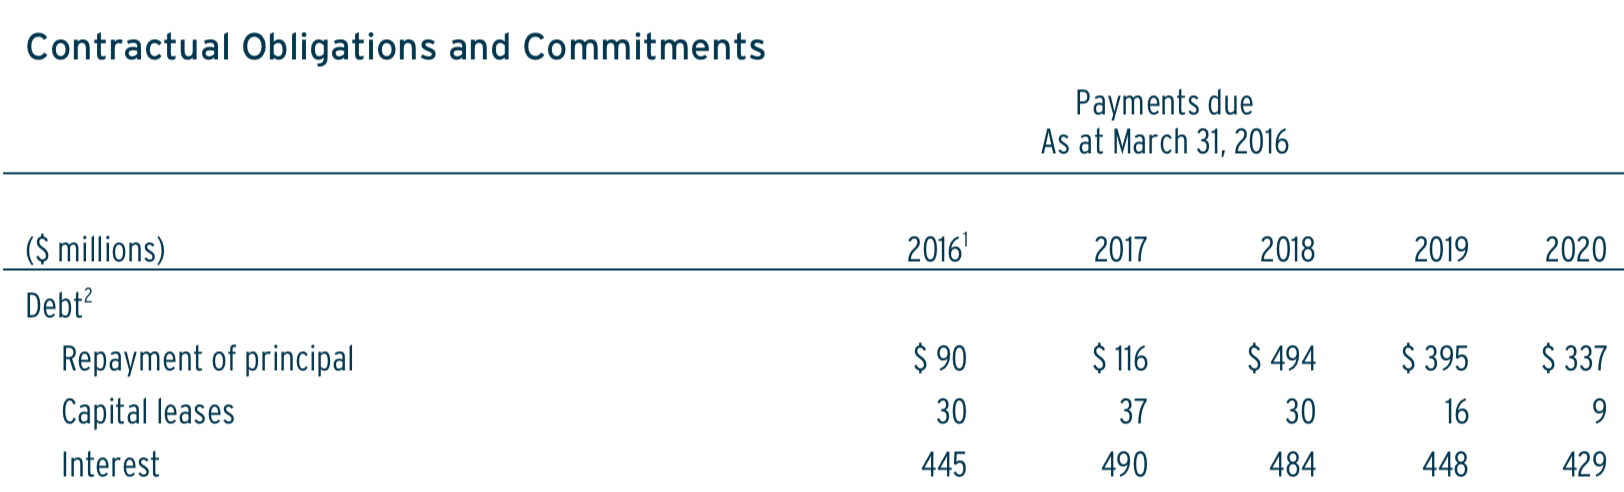
(Source: Barrick Gold)
More progress has been made on the net debt front since 2016 (almost $2 billion lower) and now the forecasted interest for this year is just over $300 million (a small portion of interest was paid in Q1). As debt continues to move lower, so will interest that is owed. This savings in interest basically flows right to the bottom line.
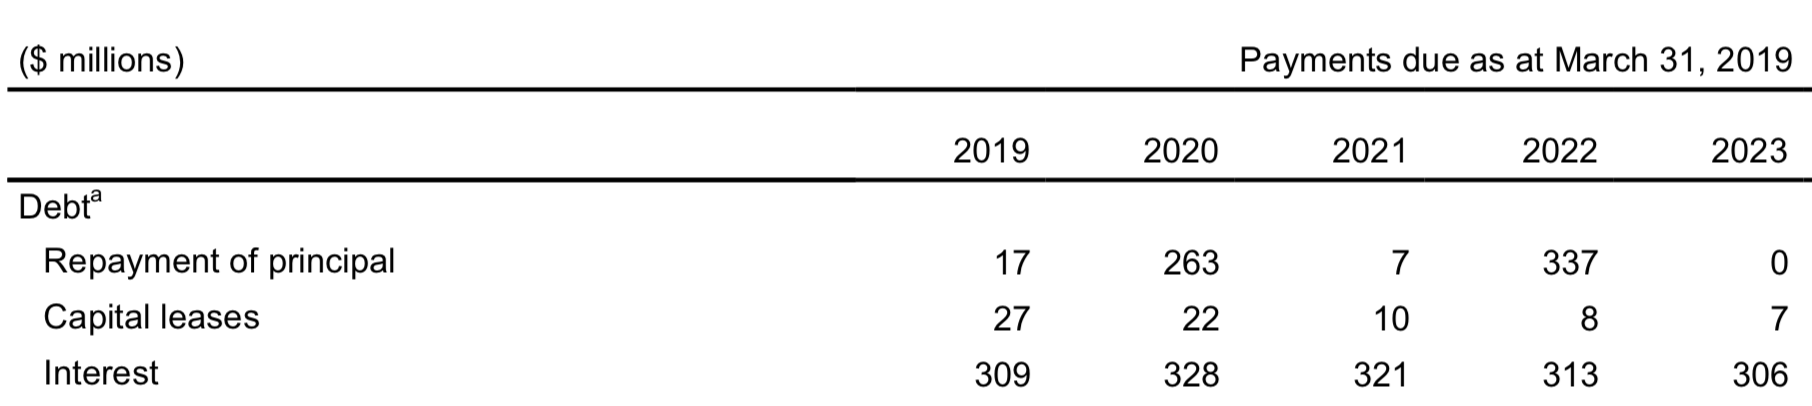
(Source: Barrick Gold)
Barrick pays about 5.5% on average on its debt. Assuming net debt reaches zero in my expected time-frame, that's a savings of an additional ~$200 million in interest per year.
That only leaves about $120 million of debt interest due annually, and that's coming from the $2 billion of remaining debt. While this debt will be offset by about $2 billion of cash (net debt of zero), I will assume the yield on the cash will be much lower than the interest on the debt given the current rate environment. Hence, there could still be ~$100 million of interest due per year, but that is a far cry from the $600+ million annual interest liability that the company had 4-5 years ago.
EBITDA strips out interest costs, but this ~$200 million of savings is still going to show up in the operating cash flow and free cash flow segment. This is an additional cash generating component that will lower Barrick's valuation multiple even further.
Strong Technical Setup
Barrick's 200-week moving average has recently turned up (after declining for the last 5 years) and GOLD is attempting to get over this resistance level. This is a very bullish technical development.
This setup in GOLD is something that hasn't been seen since the last bull market back in 2000-2011. Not even the 2016 move had this positive of a technical outlook as the 200-week was still moving lower.
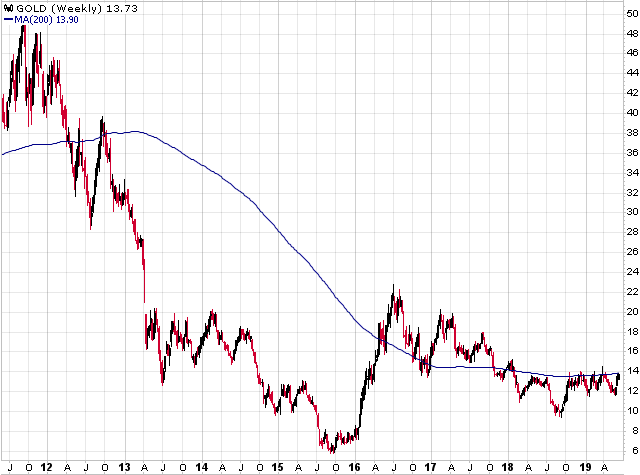
(Source: StockCharts.com)
When the fundamentals and technicals both align, that is when serious advances can take place.
Summary Bullish Thesis
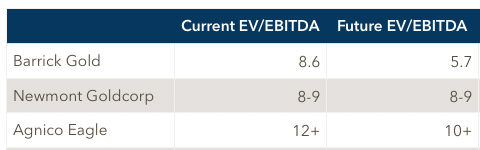
Barrick is currently trading at an EV/EBITDA of 8.6 and that ratio will be declining 30-35% over the next two years thanks to increases in adjusted EBITDA and lower net debt levels. When you account for the interest savings, the valuation will be even more compelling.
Barrick is already trading at a substantial discount to Agnico Eagle (AEM). Newmont Goldcorp is at a similar EV/EBITDA (8-9x), but I don't project their EBITDA will increase much over the next two years. NEM's production and AISC were expected to be flat in 2019-2020 before accounting for the Nevada JV. The annual savings from this JV is about 5% of current EBITDA for Newmont Goldcorp - as they are the minority owner and don't have the same exposure/leverage as Barrick. There could be other improvements for NEM that could lower their EV/EBITDA, but not nearly to the same degree as Barrick.
Barrick is the best value amongst all of the senior producers. I believe it will be re-rated higher as the market will start pricing in these improvements.
I see, at minimum, a 30% increase in GOLD over the next 2 years and that's assuming no movement in the price of physical gold. If the physical metal increases during that time, then I expect Barrick to put in a far more robust performance. I do believe gold/GLD will appreciate in value over the coming years. See my most recent article - This Is Why Gold Is Surging Higher - for more discussion on this topic. Also, be sure to follow me to stay up-to-date on all of my articles.
Subscribe To The Gold Edge
To keep up to date with how I'm playing this potential bull market in gold, just click the "Follow" button below. If you would like more in-depth analysis of the sector, including all of my top picks, subscribe to The Gold Edge. The opportunity in this sector is here, but to succeed, you need a deep knowledge of gold and the miners. The Gold Edge is my research-intensive service that provides that knowledge. I'm covering miners that are best of the best, including deep value plays, prime acquisition targets and explorers with huge upside potential. Click here for details.
Disclosure: I am/we are long GOLD. I wrote this article myself, and it expresses my own opinions. I am not receiving compensation for it (other than from Seeking Alpha). I have no business relationship with any company whose stock is mentioned in this article.
Follow SomaBull and get email alerts