Why Shale Oil Not Viable at $45WTI Anymore, OPEC Can Dictate Price Again / Commodities / Shale Oil and Gas

Why Shale wasonce Viable at $45WTI but it’s not anymore. That’s why OPEC can dictate theprice again.
Some shale operators now saythey can’t make money at $55; so they are cutting-back. But in 2017 when WTI averaged$50; output-growth was 60% higher than today. How come?In 2015, five-hundred frac-spreads,bought and paid for; some from profits, many at fire-sale; were idle; so day-ratesplunged; and so, helped by multi-pads and cheap sand, shale re-booted.In June 2019 all those spreadswere working. But now, for shale to continueto grow, more are needed. Except at $55 operators can’t pay the pumpers theday-rates they need to buy new.CAT is crying and Halliburton isstacking; holding-out for better rates. Rig count has plunged; there’s no pointdrilling if you can’t find a cheap frac-spread to complete.Now OPEC & Co can push theprice up to $75 WTI without fear of sparking a third boom. But they may makethe mistake they made in 2015; trying to kill-off shale. If they do, they willfail.Over the past year the penny that shale-oil output growthwas going down, not up, finally dropped for most commentators (1-to-7). AlthoughEIA, IEA, OPEC and Rystad Energy are all sticking with their predictions for a 900,000bpd or so build in shale production in 2020 (8-to-10). They say the slump ingrowth which started in June 2018, was because of pipeline constraints inPermian (11). But those were fixed in December 2018, yet output-growth keptgoing down.
Today oil is still priced on the assumption that the 900,000number will come in for 2020, so logically to maintain the so-called balance;OPEC will need to cut at least 400,000 more on top of the 1.2 million they are supposedlyholding-back, to keep the price where it is.
There aresigns OPEC’s solidarity is crumbling. The shorts are betting it will fall-apart;they are encouraged by inventory builds and the US-China trade war. But those buildsare mostly caused by the switch from importing oil, to exporting; and the tradewar is just politics. When traders start to doubt the 900,000 number, the pricecould spike.
Trend-line growth in shale production fell from thepeak of 168,000 bpd per month in June 2018, down to 53,000 last month, which isless than it was three years ago. Then WTI was $47, last month it averaged $57.So oil prices went-up 27% over 18-months and growth was flat; that’s notlogical.
EIA recently predicted that this December, growth willbe 49,000 bpd per month, and cup-half-full, production of U.S. shale-oil will hitan all-time-record. America is Great Again.Halleluiah!!
Cup half-empty, to hit 900,000 for 2020, monthlygrowth will need to go up 50% to 75,000.
EIA offered no explanation for how-come a trend-linethat has been going steadily down over the past eighteen-months; might magicallystart going up; particularly in the light of the evident financial woes ofoperators; plummeting rig-count; and since June, plummeting frac-spreadutilization.
Cup nearly-empty, to grow total production by 900,000bpd in 2020, total initial production (how much new oil is brought on line fromnew wells (IPt)), will need to jump by 12%.
In October 2019 IPt was down 6% on the peak inFebruary 2018.
Perhaps Santa will wave a magic-wand this Christmas?
Why did the growth-rateof Shale output go down 70% over the past 18-months?
That’s a slightly complicated story. To be clear, I’mnot talking volume (still going up); I’m talking growth (going down).
Only two numbers matter if you are interested in whereU.S. shale is going, not that many of the commentators who splash the headlineswith predictions, hardly ever mention them.
1: Legacy Loss
Legacy Loss is reported by EIA on the third Monday ofthe month for each of the seven shale-oil regions. It is highly predictable.
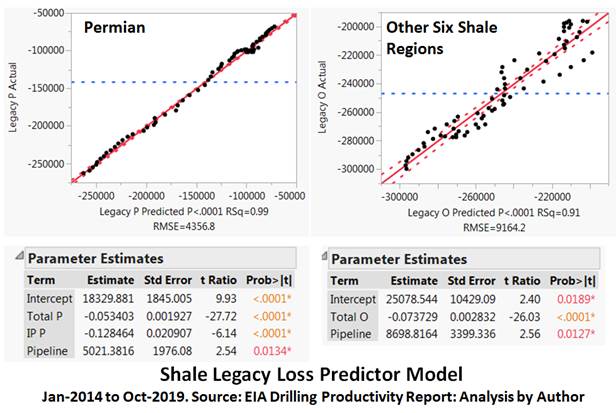
Looking at the best-fit formulas (the boxes under thecharts):
The main driver of Legacy Loss isTotal Production, which is logical.In Permian, higher InitialProduction (IPt) increased legacy loss, probably because new wells depletefaster than old wells; that was not a viable (statistically significant)explanatory variable outside of Permian, probably because those regions aremore mature and IPt as a proportion of total production is less.Pipeline woes in Permian weretested as a dummy-variable; (1=Problems (between April 2018 and December 2018);0=No problems). The model says legacy-loss was down by 5,021 bpd in Permian and8,699 elsewhere, corresponding to a drop in production of about 100,000 bpd inPermian and 120,000 bpd elsewhere, caused by pipeline constraints (3% of totalproduction). So the pipeline-woes in Permianseem to have affected other regions more, possibly because Permian operatorscould afford to pay more for alternatives (rail and road), than the others, sothe other regions got priced-out.Pipelines are now just academichistory. But at 900,000 bpd growth per year in-total (say half in Permian), itwill take three years for that capacity to fill; at 300,000 it will take ten. Guess what? The pipelineoperators are now discounting like crazy, rather than holding out for themirage of a new boom in shale; which was likely the key-assumption they madewhen they decided to build (11). Perhaps they saw now which was the wind isblowing?2: TotalInitial Production by Region (IPt)
Hardly anyone talks about IPt because EIA only reportsIP/rig, so to figure IPt by region you need to multiply Rigs x IP/rig.
Sounds odd that EIA do not directly report the mostimportant number in the shale industry, but that’s how to calculate it. You cancheck by adding up calculated IPt-minus-Legacy loss, for a year, which pretty-muchequals the reported annual increase in production, the small difference isbecause year-on-year production-change is a lagging indicator, IPt is a leadingindicator.
IPt-minus-Legacy Loss is a smooth line, so it’s easyto spot the trend. Monthly change in total production is a jaggedly line, sothe trend is hard to spot (see chart on “The History of Shale” below). Thatmight explain why it took so long for many commentators to twig that thedirection was decidedly down.
WTI-6 is a measure of the enthusiasm of operators tocall-in the pumpers for the frac, which these days can cost 70% of the CAPEX fora new well if you count the cost of the sand and the liquids, now that the costof drilling per foot is down, thanks to multi-pads and re-designed horizontaldrill bits.
Logically IPt ought to depend on expectations aboutthe price of oil over the next year. One would suppose that might depend on thedirection oil-prices took over the recent past. It does, pretty-much. The bestexplanatory variable I found was the average of the past six months WTI:
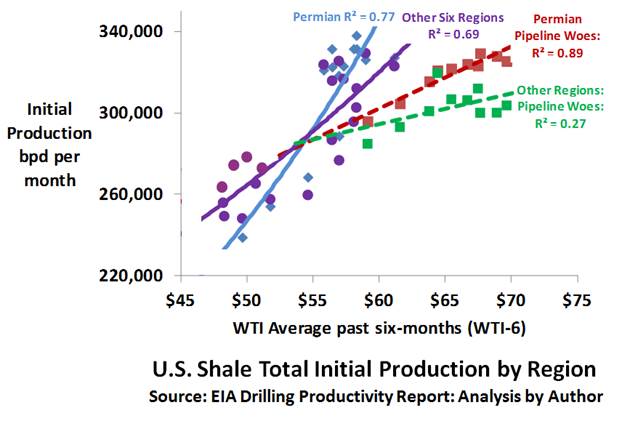
Those are not bad correlations; they say IPt is likelydriven by “expectations for the likelydirection of oil prices as measured by WTI-6”, although the relationship isdifferent depending on region and pipeline woes.
The pipeline-woes lines are for the period April 2018to December 2018. Outside of the eight months when Permian pipelines wereflowing at full capacity, and spot surcharges were as much as $10 per barrel; 70%of changes in Initial Production (IPt) could be explained by changes in WTI-6(that’s what RSquare=0.7 means).
I re-analyzed the data iteratively calculating“Effective WTI-6” for the pipeline-woes period, the best fit explanatoryvariable for that was for WTI-6 minus $6 outside of Permian (Other), and minus$5 inside Permian, reflecting the average increased cost of takeaway then.
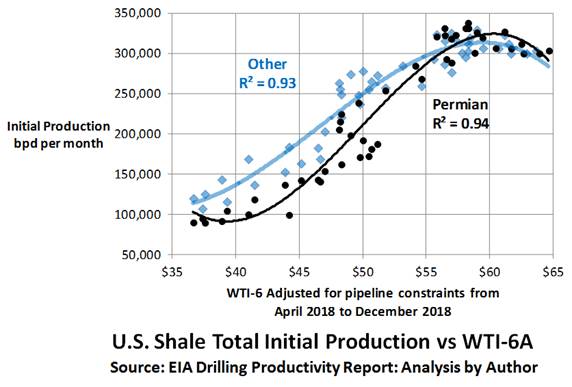
The best-fit for both regions was a third-orderpolynomial which is an approximation for an S-curve, the correlations(RSquare), were very high.
It’s easy to buy the idea that under $40 IPt wasflat, until a threshold was reached at about $45, after which it accelerated.
But one would expect that logically, IPt would accelerateexponentially at higher prices, as margins improved, but that didn’t happen,instead it started to flat-line after WTI-6A hit $55.
Looking at the data another way: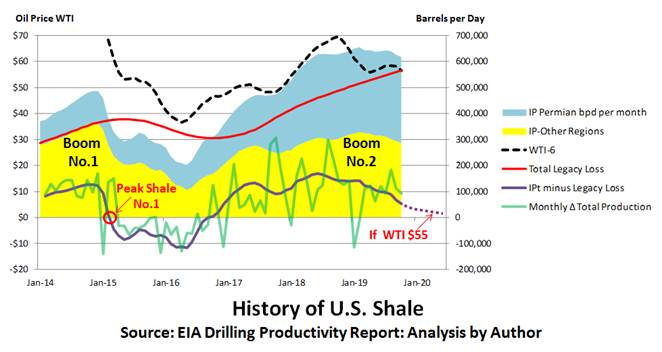
When the red line gets up above IPt, that’s Peak Shale No.2; noticein January 2019 when the pipeline issues had been sorted, there was no bouncein IPt, even though WTI-6 grew for six months after.
That’sweird.
A year-ago, the CEO of Schlumbergerwas warning of a slowdown in shale because of child-plays interfering with eachother. He put up pretty charts to explain his ideas, except I never quiteunderstood how that related to the big picture.
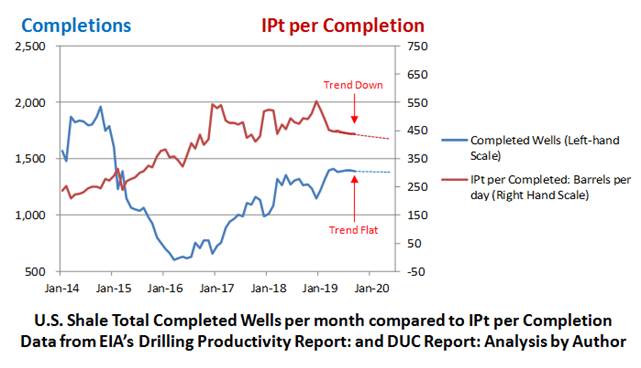
Yes the productivitygains from longer laterals and pumping more sand have been drying-up, but thereis little evidence of an increase in legacy loss as a function of totalproduction over the past year, although IPt per completion was sharply downsince January 2019, after having almost doubled since January 2014, but that’shardly a trend, yet.
So, looking at the charts, I’m scratching my head; wondering what’sgoing on?
Then I remembered aconversation I had with a gentleman from Houston-Texas. You could tell he wasfrom there because he was wearing $500 cowboy boots, presumably because inTexas everyone rides to work on horseback?
He didn’t seem to knowmuch about horses, but he knew a lot about oil, much more than me.
That was in mid 2016;when WTI was settling at over $45, we were talking about rack, he cuts the bestrack in the world.
My penny dropped.
This is the story onthe frac-spreads:
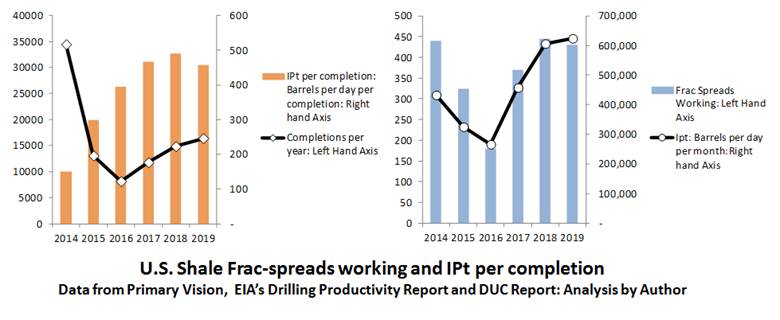
What changed from 2014was laterals got longer, so IP per completion went up from 150 to 500 bpd per completion;completions per year went down from 35,000 to 15,000, and average IPt(annually) went up from a little over 400,000 bpd/month to a little over600,000 bpd/month, likely not so much because of a technological marvel in thefrac, more likely because on the multi-pads, with longer laterals, you don’tneed to dismantle and re-build the frac-spreads so often.
What didn’t change wasthat in 2014 the fleet of frac-spreads was 500; in 2019 the same fleet wasworking, flat-out.
Looks like the fleetcannot bring in more than 650,000 bpd per month. Shale is very simple, IPt is afunction of how much sand you pump, and if sand is plentiful and cheap, whichit is now, that’s a function of how many frac-spreads you got, which is why(right-hand chart), since 2016, IPtcorrelated almost perfectly with the numbers of frac-spreads deployed.
In order for IPt togrow faster than legacy loss is growing, there will need to be additions to thefleet, with the proviso, looking at the chart; that WTI-6 settles at more than$55.
But there’s a problem,a new diesel frac-spread costs $30 Million, the e-fleets that have gas-turbinespowering generators that drive the pumps, which are more environmentally friendly,much quieter, and don’t cover everything in soot, cost $60 Million (12).
Operators like thee-frac spreads because the gas is free; and you can spend $350,000 on diesel fora frac (new wells cost $6 to $8 million these-days, all-in).
But pumpers don’t wantto invest in new spreads, particularly because the way the industry is going,if you buy-new, you need to buy the latest technology; e-frac.
I couldn’t find goodnumbers on what frac-spreads make as a day-rate, the latest analysis I foundwas by EIA in 2016 (13), but rule of thumb from other types of oil-fieldequipment, I guess about $500,000 per frac just for the spread.
For the sake ofargument, and I may have these numbers completely wrong; say 20 fracs per yearthat’s $10 million per year, just renting-out the frac-spread without the costof the crew. The spreads take a beating on the frac, so after wear-and-tear andthe cost of refurbishment, net might be $5 million per year.
So if you bought a hardly-usedfrac-spread from a liquidator in the bust in 2015, for $10 million, you wouldpay-back in two years. Good business, could explain why everyone jumped back-inwith such enthusiasm.
But if you buy a newdiesel-spread for $30 million, today, and the rates are the same, your paybackwill be six-years; that’s no good on a speculative investment in equipment thatcould be obsolete in ten years.
For the pumpers tostart to get greedy again, the cost of the spread for a frac will need to go upby $1 million, that’s a big chunk when currently new wells cost $6 million to$8 million each.
If you buy a newelectric spread for $60 million, even after getting an extra $350,000 per fracfrom free gas, the cost of the spread for the frac will need to go up by $1.75million, before the pumpers start to have dollar-signs in their eyes.
What’s happening now isthat the spread you bought for $10 million in 2016; is likely worth $20million, because depreciated replacement cost is a function of the useful lifeleft, and how much a new one costs using latest technology.
That’s of course thevalue to you, but you might even be able to sell it for that, because of upwardpressure on day-rates, because utilization is so high.
So the best thing foryou, would be to stack 25% to 50% of your fleet (it costs almost nothing tostack now the units are paid for), and wait until oil prices go up, so yourcustomer can afford to pay the higher rate, so you can afford to start to buynew.
Or if that doesn’thappen, wait until your customer goes broke and his assets get sold fire-sale,and the proud new owner can afford to pay your price.
That’s what Halliburtonjust did (14).
I may have got thenumbers completely wrong, but one thing is for sure; what no-one is doing isrushing-out to buy new e-frac spreads at $60 million a pop, which is why CAT iscrying (15). The gas-turbines for those have a nine-month delivery, (that’swhat I was quoted for a unit last week), so until the orders start to pile in,day-rates for frac-spreads will be going up, regardless of what happens tooil-prices.
That doesn’t mean PeakShale will happen any time soon, so long as:
Running the numbers for the algorithms forlegacy-loss (above), assuming IPt flat-lines at 600,000 bpd/month, in otherwords, no one starts to rush out and buy new frac spreads, and even if they do,those don’t get delivered in 2020; says growth in shale oil output in total in 2020will be less than 450,000 bpd, i.e. half of what EIA, IEA and Rystad arepredicting.
That’s not Peak Shale, but it’s not a boom, in 2018growth was 1.7 million bpd per year.
Meanwhile, some folksover at OPEC & Co have started to notice the writing on shale-oil’s wall,notably the Russian Oil Minister (16).
If this analysis isright, they can cut a little more in December, and then stand back, and watch WTIgo to $75, without risking igniting a third Shale-Boom.
Looks like there may belight at the end of the tunnel for conventional oil-service and E&P companies,for example like Transocean (RIG), up 20% since it’s bottom in October.
But will they?
Russia is cheating andthe Saudi’s are signaling they are not willing to go on taking on the lion’sshare of the pain.
On reflection, OPECmade a big blunder in 2015 when they decided not to cut, so as to “protectmarket share”, which translated into English meant, “Kill Shale”.
If they had cut, Brentwould likely have bottomed at $67, as predicted by the one commentator who sawthat a massive bust was on the cards, three years before it happened.
In which case, manyoperators who went bust; would not have gone bust.
So their almost-newfrac-spreads would not have been sold at auction for penniesSo the investors who had financedthose, would have insisted that they get a decent return on the $30 million.So they would have held out forhigher day-ratesSo the breakeven cost wouldhave stayed high.But when Brent hit $35,the investors got wiped-out, assets were sold by banks for pennies, and thesurvivors could offer spreads priced one-third of the price in 2014.
So combined with thenew multi-pads, cheaper sand, and faster horizontal drill-bits; shale becameviable at $45 when only two years before it had hardly been viable at $100.
That’s the beauty ofU.S. bankruptcy laws.
Whether OPEC willstand-hard on the present cuts, and even cut a little more; is hard to predict,but we shall learn soon what they decide.
One thing is sure; theycan take back control now, if they want.
Wouldn’t it be ironicif this time OPEC lent a helping hand to the U.S. shale industry, so it could bea little more profitable, so the wave of bankruptcies is slowed and there is norepeat of the carnage in 2015 that drove down costs.
Whilst of coursekeeping an eye on CAT’s order book for turbines for new frac-spreads, and when(not if) that starts to fill, aim to do a bit of market-share-protection afternine months, just in time for deliveries to start. The threat of that mightkeep the pumpers holding tightly onto their wallets until Brent hits $100.
References:
1.https://www.bloomberg.com/news/articles/2019-10-14/peak-shale-how-u-s-oil-output-went-from-explosive-to-sluggish
2.https://www.washingtonpost.com/business/energy/americas-great-shale-oil-boom-is-nearly-over/2019/10/13/31650cde-ed87-11e9-a329-7378fbfa1b63_story.html
3.https://www.worldoil.com/news/2019/11/6/shale-oil-pioneers-say-the-boom-times-are-over
4.https://www.dallasnews.com/business/energy/2019/07/12/is-the-red-hot-permian-basin-beginning-to-flame-out/
5.https://www.worldoil.com/news/2019/11/7/us-oil-production-growth-in-for-a-major-slowdown-says-ihs-markit
6.https://oilprice.com/Energy/Crude-Oil/The-EIA-Is-Grossly-Overestimating-US-Shale.html
7.https://www.forbes.com/sites/daneberhart/2019/11/01/the-great-shale-slowdown-has-arrived/#6d03eb943755
8.https://www.eia.gov/todayinenergy/detail.php?id=38832
9.https://www.rystadenergy.com/newsevents/news/press-releases/us-shale-to-grow-to-14.5-million-bpd-by-2030/
10.https://www.forbes.com/sites/gauravsharma/2019/11/05/opec-sees-flood-of-us-shale-barrels-hurting-demand-for-its-crude-oil/#6646d11074b7
11.https://www.reuters.com/article/us-usa-permian-pipeline/new-us-pipelines-poised-to-start-price-war-for-shale-shippers-idUSKCN1UY2EG
12.https://www.reuters.com/article/us-usa-oil-electric-fracturing-focus/low-cost-fracking-offers-boon-to-oil-producers-headaches-for-suppliers-idUSKCN1VX112
13.https://www.jwnenergy.com/article/2016/7/here-are-five-main-costs-frac-job-us/
14.https://oilprice.com/Energy/Energy-General/Oil-Giant-Slashes-Jobs-Amid-Shale-Slowdown.html
15.https://www.bloomberg.com/news/articles/2019-10-23/fracking-slowdown-weighs-on-caterpillar-as-sales-of-pumps-drop
16.https://oilprice.com/Energy/Oil-Prices/Russia-Predicts-The-Death-Of-US-Shale.html
By Andrew Butter
Twenty years doing market analysis and valuations for investors in the Middle East, USA, and Europe. Ex-Toxic-Asset assembly-line worker; lives in Dubai.
© 2019 Copyright Andrew Butter- All Rights Reserved
Disclaimer: The above is a matter of opinion provided for general information purposes only and is not intended as investment advice. Information and analysis above are derived from sources and utilising methods believed to be reliable, but we cannot accept responsibility for any losses you may incur as a result of this analysis. Individuals should consult with their personal financial advisors.
Andrew Butter Archive |
© 2005-2019 http://www.MarketOracle.co.uk - The Market Oracle is a FREE Daily Financial Markets Analysis & Forecasting online publication.