Why Solar and Wind Energy Can't Save Us / Commodities / Energy Resources

Recently,British Petroleum (BP) went public in declaring that “peak oil demand” wasreached in 2019. According to the oil major’s 2020 outlook, global oil demandwill not regain levels reached last year, and that demand could soon fallrapidly, due to stronger climate action by countries, by at least 10% over thenext 10 years, and up to 50% by 2040.
Demandfor the fossil fuel has doubled over the past 50 years, reaching around 100million barrels of oil per day (bopd) in 2019.
Whileearlier editions of BP’s outlook stated that global demand would continuerising steadily, peaking in the mid-2030s, the latest version sees the declineas much more dramatic, with peak demand already reached in 2019, and eitherslowing down or plateauing over the next three decades.
Themagnitude of the fall in demand depends on the degree to which global carbonemissions are addressed/ cut by governments and industry.
Thelargest reductions in oil demand are modeled by BP’s “rapid” and “net-zero”scenarios. Here, global carbon dioxide emissions plummet by more than 95% by2050, compared to their 2018 levels. This is accomplished by significantlylower usage of fossil fuels, ie., coal, oil and natural gas. According to theInternational Energy Agency (IEA), last year total energy-related CO2 emissionsfell by 3.2%, with the power sector, which accounts for 34% of energy-relatedemissions across advanced economies, leading the decline.
Butthe need for electricity hasn’t decreased; if fossil fuels in future accountfor a lower percentage of the global energy mix, the loss will have to be madeup, from non-carbon sources.
Undernet zero, BP predicts solar and wind power will see explosive growth over thenext 15 years, with demand reaching around 2,000 million tonnes of oilequivalent (Mtoe) in 2035, quadruple the 500Mtoe used in 2019.
By2040, use of renewables more than doubles again, to an amount equivalent to thecurrent total from coal and natural gas combined.
Incontrast, coal sees the most dramatic decline, with demand for the dirtiest offossil fuels dropping by a third by 2030 and around 90% by 2050.
Naturalgas is also looking at a major reduction in usage. BP's 2020 outlook showsdemand for NG peaking in 2025 under net-zero, then falling to 36% below 2019levels by 2050. The “rapid” scenario has NG demand peaking in 2035, returningto 2019 levels by mid-century.
(AtAOTH, we have already written the real story of fracked gas. The US ‘Sultans of Shale’ have had it good for a long time, but theparty in the Permian and other US oil shale basins is coming to an end. Notright away, but at most, the fast-depleting shale oil fields which produce viahydraulic fracturing and horizontal directional drilling, are likely to lastanother five to seven years. In October, Reuters reported thatoutput from seven major shale formations is expected to decline by about 68,000bopd, to 7.6 million bopd.
This is because shale oil wells aregushers in their first year, then deplete rapidly. Shale companies aretherefore money losers because they have to keep ploughing more money intoproduction just to keep output flat, a phenomenon known as “The Red Queen Syndrome.” Shale wells typically bleed off 70 to 90% in their first three years,and drop by 20 to 40% a year without new drilling. According to consultancyWood Mackenzie, Permian production could peak in 2021 versus the moreoptimistic 2025.)
Let’sstop for a moment to explain what BP is saying here. Economists will quibbleover when peak oil demand is reached, and how much market share fossil fuelswill lose to non-carbon sources. The up-shot, according to BP, is that oil,coal and natural gas are dead in 20 years. Coal will die before oil, which willrun out prior to the end of natural gas, seen by many as a transition fuel torenewable energy sources.
Ifwe accept that the end of fossil fuels is nigh, the next question is, what willreplace them? For BP, the answer is clearly renewables. Here is an excerpt fromthe 2020 outlook, quotedby Carbon Brief: In the net-zero scenario, renewables supply some 130EJ in 2030,more than four times their output in 2019 and similar to current supplies fromgas. By 2040, renewables more than double again to reach 296EJ, equivalent tothe current total from coal and gas combined.
Still a carbon economy
Wow.Really? The table below from the IEA’s ‘Global Energy Review 2019’ shows globalelectricity generation in 2019 dominated by fossil fuels, with coal and gasrepresenting 59% of the total 26,951 terrawatt hours (TWh) generated. Solar andwind accounted for just over 2,000 TWh.
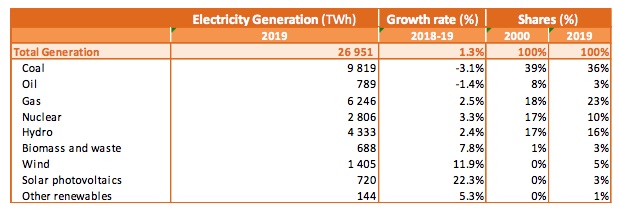
Source: IEA, ‘Global Energy Review2019’
SoBP is telling us that in 20 years, these renewables energy systems, which arenot suitable as base-load power because their plants cannot run continuously(they can only make electricity when the sun shines or the wind blows) aregoing to jump from 2,000 TWh, to 16,000 TWh, an 8-fold increase?
Weget further into the math below, but for now, we want to focus on 2019. Acloser look at the IEA report shows a global economy that continues to run onoil and gas, and to a surprising extent, coal.
Insum, the report states that, while renewable energy is certainly gaining marketshare, it remains a relatively low 12% of total electricity generation (just12% including solar, wind, biomass & waste), which is still dominated bycoal and natural gas.
Forexample, while demand slipped 1.7% in 2019, coal continues to represent thelargest source of electricity generation in the world, with a share of 36%.It’s also true, however, that 2019 was the first year in which low-carbongeneration, ie., renewables, hydro and nuclear, produced more electricity thancoal. Generation from coal-fired plants in advanced economies dropped nearly15% last year, due primarily to utilities switching from coal to cheaper andcleaner natural gas. The only regionwhere coal demand increased significantly was Southeast Asia, where coal usegrew over 10%.
Source: IEA, ‘Global Energy Review2019’
Yetdespite moves in various countries to decarbonize, oil continues to be in highdemand. Last year oil requirements in China rose by 680,000 barrels per day,the highest growth rate since 2015. There was also strong Chinese demand fortransportation fuels, ie., gasoil/ diesel and gasoline.
Aftertwo years of strong gains, natural gas consumption growth cooled in 2019 to1.8%, or 70 billion cubic meters. However, NG demand was second only to growthin demand for renewables, thereby pushing its share of the global energy mix toa historic high of 23%, the IEA report states. The two main growth markets forNG were the United States and China, which accounted for more than two-thirdsof the increase in global natural gas consumption.
Thereason for pulling some of these stats from the IEA report, is to show howresilient the fossil fuel sector is. Combined, they cast a penumbra of doubt onthe light of positive messaging regarding the renewable energy growth story.
Wedecided to go a couple of steps further, in determining whether it is evenpossible, as the BP report suggests, for renewable energy to replace fossilfuels in 20 years. That’s step one in the calculations below. The next step isto find out what that would mean in terms of materials consumption. How manysolar plants, how many wind farms, would have to be built to replace the 80% ofglobal energy currently demanded by fossil fuels? How much metal would go intothem?
Wind and solar: a pipedream
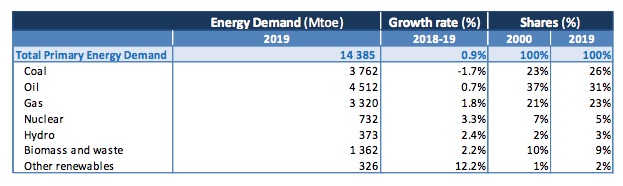
Fromthe blue table above, notice that world energy demand in 2019 was 14,385million tonnes of oil equivalent (Mtoe). Stripping out fossil fuels leaves ahole of 11,594 Mtoe. To fill it with renewables would require an additional11,594 Mtoe, of biomass & waste, hydro and other renewables, on top ofrenewables’ existing 2,061 Mtoe, for an increase of 462%!
Mtoeis a clunky measurement to work with. Convert 11,594 Mtoe to gigawatt hours(GWh) by multiplying by 11,630 (1 Mtoe = 11,630GWh) = 134,838,220 GWh. This is the amount of electricity generated by fossilfuels in 2019. If we get rid of all fossil fuels - oil, NG and coal - in 20years, we need to generate an additional 134,838,220 GWh of renewable energy.
1gigawatt hour (GWh) = 1,000.00 megawatt hours (MWh).
A large solar farm would be 500 megawatts(MW), keeping in mind that the biggest solar farm in the US, the Topaz/ DesertSunlight, is 550 MW, the biggest in the world is 1,547 MW; most solar farms in the US are much smaller, less than 5 MW).
Let’s say it is able to operate half thetime, or 182 days. 500 MW x 24 = 12,000 MWh x 182 = 2,184,000 MWh.134,838,220,000 MWh divided by 2,184,000 = 61,739 500 MW solar farms.
What does this mean for materials? Weknow from a previous article, that a500-MW solar conversion plant would cover 25 to 50 square miles with 17,500tons of aluminum, a million tons of concrete, 3,750 tons of copper, 300,000tons of steel, 37,500 tons of glass, and 750 tons of other metals such aschromium and titanium — 500 times the material needed to construct a nuclearplant of the same capacity.
According to a 2018 paper by theInternational Association for Energy Economics (IAEE), the type of solar PVtechnology will dictate which metals are used:
Crystalline silicon (c-Si) - Ag, Ni, Al,Cu and FeAmorphous silicon (a-Si) - Ni, Cr, Ge, Mo, Al, Cuand FeCadmium Telluride (CdTe) - Ni, Cr, Mo, Cd, Al,Te, Cu and FeCopper indium gallium selenide (CIGS) - Ni, Cr,Mo, Al, Cu, In, Fe, Ga and Se
The author identifies eight types oforebodies that supply the elemental needs of PV technologies: gold, nickel,chromium, molybdenum, zinc, copper, aluminum and iron ore.
The amount of aluminum and copper neededto build that many solar farms is off the charts:
17,500 tons aluminum x 61,739 (500 MW)solar farms = 1,080,432,500t @ 64 million tonnes (MT) global production (2019USGS) = 1,080,432,500 tonnes aluminum required or 16x global production
7,500 tons copper x 61,739 (500 MW) solarfarms = 463,042,500t @ 20Mt global production (2019 USGS) = 463,042,500 tonnescopper required or 23x global production
But it’s not only the amount ofmaterials, but the land, that would have to accommodate the more than 61,000new solar farms. A study by Denholm and Margolis calculated the per capita solar footprint per person, based on theassumption that electricity needs in each state are met by solar power alone.According to the authors, via a blog by Dr. Werner Antweiler, who teaches at the UBC Sauder School of Business, the number rangefrom about 100 square meters per person in California, to 300 square meters inWyoming. Using current populations, that accounts for 3,951 square kilometersin California, and 173.6 square kilometers in Wyoming. Using an average of 200square meters per capita, extrapolated to the population of the whole country,of 328.2 million, gives a figure of 65,640 square kilometers of land requiredfor solar energy — a size roughly equal to the size of Nevada. Not taken intoconsideration is the amount of land needed to fit renewable energy storagebatteries.
Is wind power any more feasible? The 10 largest wind farms in the world range from 630 megawatts to 20 gigawatts. Taking a 500MW wind farm, to facilitate a comparison between solar and wind, the Manhattan Institute estimates that replacing the output from a single 100 MW natural gas-firedturbine, would require at least 20 wind turbines, each about the size of theWashington Monument, occupying 10 square miles (25 square kilometers) of land.Upsizing that to 500 MW would thus require 100 wind turbines, on 125 square km.That’s just for one one wind farm equivalent in size to a natural gas or solarplant.
How many wind farms would be required toproduce 134,838,220 GWh of electricity, the amount needed to replace fossilfuels? A 2-MW wind turbine with a 25% capacity factor (the actualoutput over a period of time as a proportion of a wind turbine’s capacity), due to intermittency, can produce 4,380 MWh in a year. Upsizing this to500 MW = 1,095,000 MWh. 134,838,220,000 MWhdivided by 1,095,000 MWh = 123,139 wind farms @ 500 MW each.
Back to land considerations, according toDr. Antweiler’s research, to replace about 20% of Canada’s power generationthat is still from combustible fuel sources, the country would need four timesas many wind farms as today. Finding space for that many, a total of 46,800 MWof nameplate capacity, would require 26,676 square kilometers. This is the sizeof five Prince Edward Islands, or around half of Nova Scotia. Remember this isjust to replace 20% of Canada’s electricity still generated from fossil fuels.Consider that in the United States, around 63% of its power still comes fromcoal, oil or natural gas. According to the Energy Information Administration,replacing the 966 TWh generated from coal in 2019, would require 344.6 GW ofwind farm capacity, spread over 200,000 square kilometers! (about the size ofNebraska)
Howabout materials? According to a report from the NationalRenewable Energy Laboratory, wind turbines are predominantly made of steel, fiberglass,resin or plastic (11-16%), iron or cast iron (5- 17%), copper (1%), andaluminum (0-2%). This isn’t counting the electrical system, which uses copperand rare earths such as dysprosium and neodymium.
Asingle 2-MW wind turbine weighing 1,688 tons, comprises 1,300 tons of concrete,295 tons of steel, 48 tons iron ore, 24 tons fiberglass, 4 tons each of copperand neodymium, and .065 tons of dysprosium. (Guezuraga2012; USGS 2011).
TheManhattan Institute estimates that building a 100-MW wind farm would require30,000 tons of iron ore and 50,000 tons of concrete, along with 900 tons ofnon-recyclable plastics for the large blades. The organization says that forsolar hardware, the tonnage in cement, steel and glass is 150% greater than forwind, to get the same energy output.
Accordingto The Institute for SustainableFutures at the University of Technology Sydney, Australia analyzed 14 metals essential to building clean techmachines, concluding that the supply of elements such as nickel, dysprosium,and tellurium will need to increase 200%–600%.
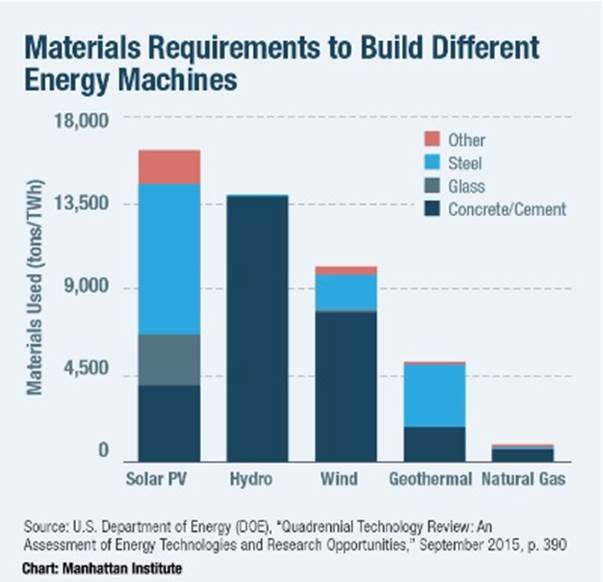
Materials required to build solar PV, hydro, wind, geothermal andnatural gas machinery. Source: Manhattan Institute
Conclusion
If BP is correct in its outlook that intwo decades, renewables are going to supply the equivalent amount ofelectricity currently generated by coal and gas combined, we have a problem,Houston. First of all, just replacing the current amount of energy demanded bycoal and natural gas, let alone the inevitably higher figure in 2040, withsolar and wind (about 11,500 Mboe, from the blue table above), would be nothingshort of miraculous. Our research shows that it would mean over 60,000 solarfarms and more than 120,000 wind farms. In all it’s about a 450% increase inrenewables.
Of course, solar and wind farms can’t belocated just anywhere. They need to be in the right locations, where the windsare strong and frequent, areas that get a lot of sunshine, and close enough topower lines to be economical. Consider: putting up enough wind farms in the USjust to replace coal, in an area the size of Nebraska (or half the size of NovaScotia, here in Canada), is bound to come into conflict with towns and cities,where residents’ commitment to renewable energy vs fossil fuels will surely betested.
We already know that we don’t have enough copper formore than a 30% market penetration by electrical vehicles. Building renewable energy capacity is overand above supplying the ever-growing marketplace for EVs. How are we going toget enough solar and wind to produce a minimum of 134,838,220 GWh (that's for2019, it could be double by 2040), if we are to replace fossil fuels in 20years?
And even if we could, how are we going tofind the raw materials? For solar power we are talking about finding 16 timesthe current annual production of aluminum, and 23 times the current globaloutput of copper. Up to six times the current production levels of nickel,dysprosium and tellurium are expected to be required for building clean-techmachinery. Good luck!
We need a new fuel source to supply the energy requiredby the coming electrification of the global transportation system, and fortransforming the world energy nexus from fossil fuels to non-carbon sources. Inour next article, we’ll tell you what that fuel is.
By Richard (Rick) Mills
If you're interested in learning more about the junior resource and bio-med sectors please come and visit us at www.aheadoftheherd.com
Site membership is free. No credit card or personal information is asked for.
Richard is host of Aheadoftheherd.com and invests in the junior resource sector.
His articles have been published on over 400 websites, including: Wall Street Journal, Market Oracle,USAToday, National Post, Stockhouse, Lewrockwell, Pinnacledigest, Uranium Miner, Beforeitsnews, SeekingAlpha, MontrealGazette, Casey Research, 24hgold, Vancouver Sun, CBSnews, SilverBearCafe, Infomine, Huffington Post, Mineweb, 321Gold, Kitco, Gold-Eagle, The Gold/Energy Reports, Calgary Herald, Resource Investor, Mining.com, Forbes, FNArena, Uraniumseek, Financial Sense, Goldseek, Dallasnews, Vantagewire, Resourceclips and the Association of Mining Analysts.
Copyright © 2020 Richard (Rick) Mills - All Rights Reserved
Legal Notice / Disclaimer: This document is not and should not be construed as an offer to sell or the solicitation of an offer to purchase or subscribe for any investment. Richard Mills has based this document on information obtained from sources he believes to be reliable but which has not been independently verified; Richard Mills makes no guarantee, representation or warranty and accepts no responsibility or liability as to its accuracy or completeness. Expressions of opinion are those of Richard Mills only and are subject to change without notice. Richard Mills assumes no warranty, liability or guarantee for the current relevance, correctness or completeness of any information provided within this Report and will not be held liable for the consequence of reliance upon any opinion or statement contained herein or any omission. Furthermore, I, Richard Mills, assume no liability for any direct or indirect loss or damage or, in particular, for lost profit, which you may incur as a result of the use and existence of the information provided within this Report.
© 2005-2019 http://www.MarketOracle.co.uk - The Market Oracle is a FREE Daily Financial Markets Analysis & Forecasting online publication.