Why You Should Be Bullish On Gold
Gold rose to the predicted level of the prior article.
The spread between the 5-year and 2-year U.S. treasury yield has turned towards the downside.
The technical picture of gold looks positive, all thanks to the bullish candle breaking above the 200-day moving average on the weekly chart.
In my last article on October 26th, I was bullish on gold (GDX, ASA) as I expected it to have a rise in its value. This came true as the yellow metal rose till the key resistance level at $1,238.33. Thus, in this article I shall look at the probability of gold having a further rise against the U.S. dollar. Hence, to establish the likelihood of this occurring, I will look at the fundamental news affecting the commodity, whilst, also analyzing the charts using technical analysis tools.
Fundamental news:
Trade war:
Gold has always had a special relationship with the U.S. dollar and this is one of the key reasons I expect a rise in the commodity's price in the coming days. This is as the meeting between China and the United States has thrown the greenback into a tailspin. I say this as most investors did not expect President Trump to be hostile against the deal he made with Chinese President Xi Jinping. This is as the arrest of the Huawei executive escalates tensions between the parties, which could hurt the position of the United States in the trade talks. Hence, due to this I expect the U.S. dollar to have a fall in its value in the coming days. This is as gold will be seen as a safe-haven asset amongst global investors. Moreover, the risk associated with the greenback has currently risen, which will cause funds to flow towards the most dependent and recession-proof asset in history, which is gold.
United States Federal Reserve:
The words of the Federal Reserve Chair Jerome Powell have had an impact on all sectors of the financial market. This serves as proof that American interest rates influence global markets. I say that as movements in the Treasury market dictate the directionality of all major sectors. The reason I chose to highlight this is due to Jerome Powell's words causing a move in the yield curve. This is as he decided to adopt a more dovish tone than he did two months ago when he had stated that the rates were a long way from neutral. Moreover, Jerome Powell's current tone makes investors believe that the Federal Reserve is finally coming closer to the neutral level. Thus, due to this I expect a rise in the value of gold in the future.
U.S. yield curve:
Gold's value hit a high of $1,254 on Friday, which places the price of the yellow metal a bit lower than its prior high six weeks ago. However, I expect the value to rise further due to the bullish run having support from the curve inversion seen in treasury yields. This is as the spread between the 5-year and 2-year treasury yield has turned towards the downside. Moreover, I expect the situation to worsen for the U.S. dollar if the spread between the 10-year and 2-year treasury yield turns negative. This is as it would trigger a constant flow of funds from the U.S. dollar's piggy bank to the yellow metal's piggy bank.
December rate hike:
Federal Reserve policy makers will be gathering at a meeting on December 18th and 19th. At this meeting the central bank is expected to raise the interest rates. However, I do not see this affecting the yellow metal as I believe a rate hike has already been priced in by the markets. The only insight I believe most traders will be looking out for is clues on the rate hike timings for 2019.
Brexit:
I expect Brexit to benefit gold in the coming days. On December 11th, the British Parliament will be deciding on the European Union divorce deal. Thus, this increases the stress level on the British pound which will result in the buying interest for gold rising. This is as investors will put a fresh bid for the commodity, as it is seen as a safe-haven alternative.
Technical analysis:
Daily chart:
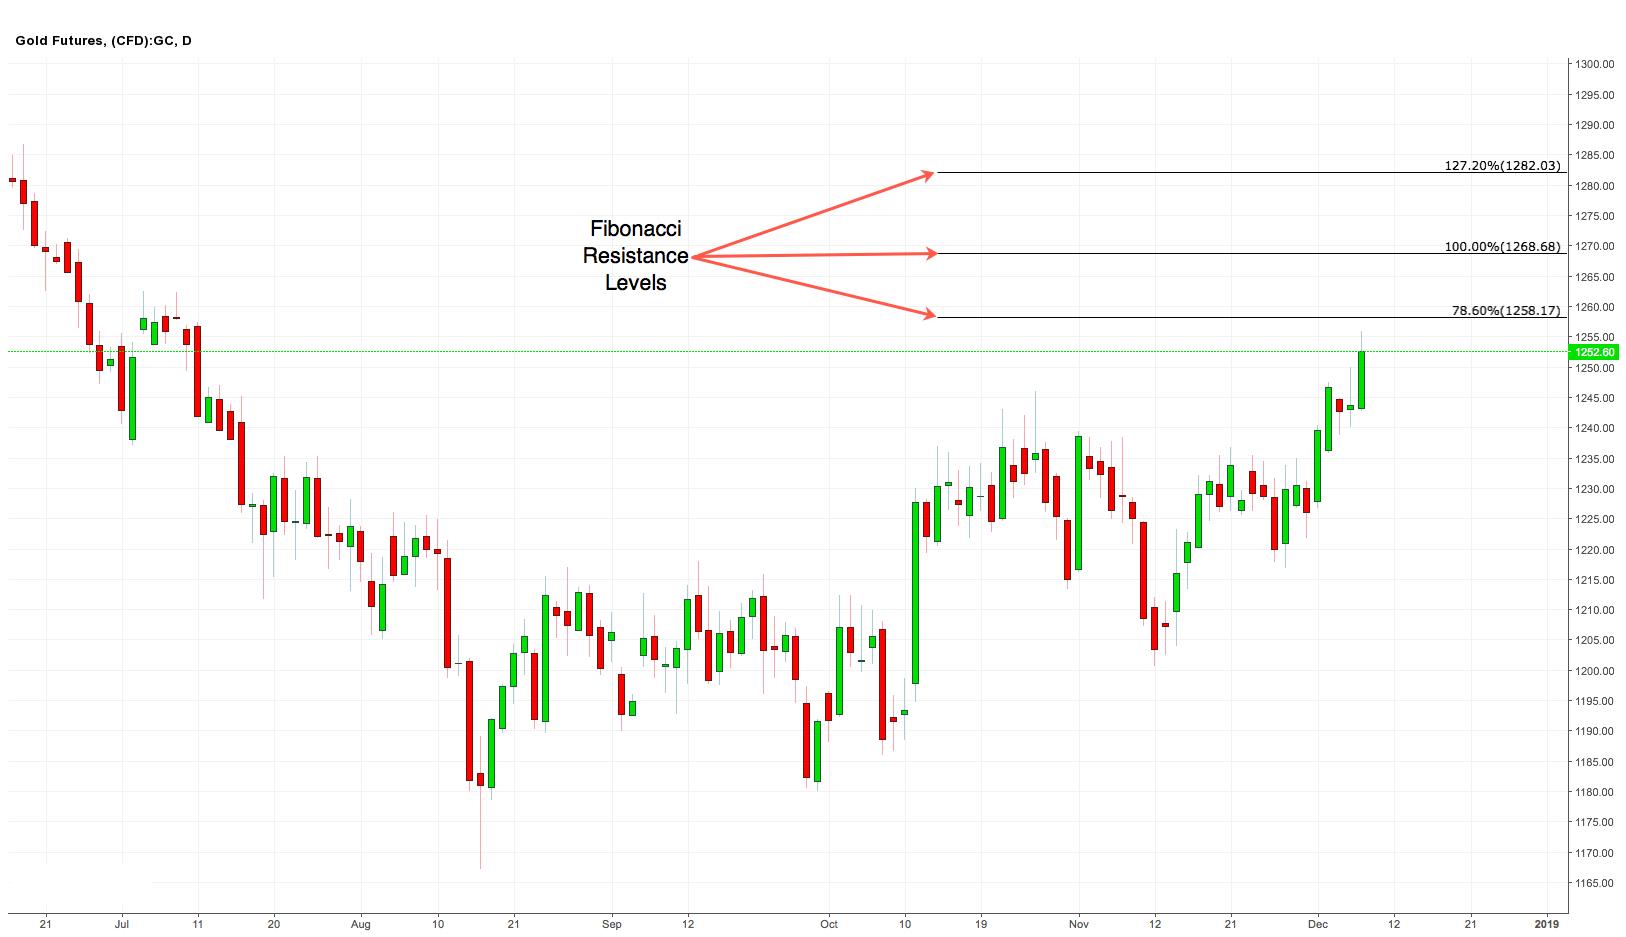 The commodity's daily chart indicates that gold will be having a bullish continuation. I say that as the commodity has formed a 'High Wave' candle pattern after which it formed a large bullish candle pattern. The High Wave candle indicates to traders that the market is confused or as the Japanese say the market has "lost its sense of direction." However, the next day's large bullish candle indicates that the bulls have the upper hand. Moreover, the bullish strength is reinforced as the current candle's close is above a key resistance level at $1,242.35.
On the indicator facet, the RSI has just ascended above the 60-mark, thus supporting the notion that the yellow metal will be having an upwards trajectory. Moreover, the short- and long-term ADX levels have perched between the range of 38 and 41. This indicates to investors that the bullish trend is robust.
On the price target front, I expect gold to rise till the range between the 78.6% and 100% Fibonacci resistance levels. The 78.6% Fibonacci resistance level is at $1,258.17, whilst the 100% Fibonacci resistance level is at $1,268.68. However, if the commodity does breach the 100% resistance level, then I do not expect the rise to go beyond the 127.2% Fibonacci resistance level at $1,282.03.
Weekly chart:
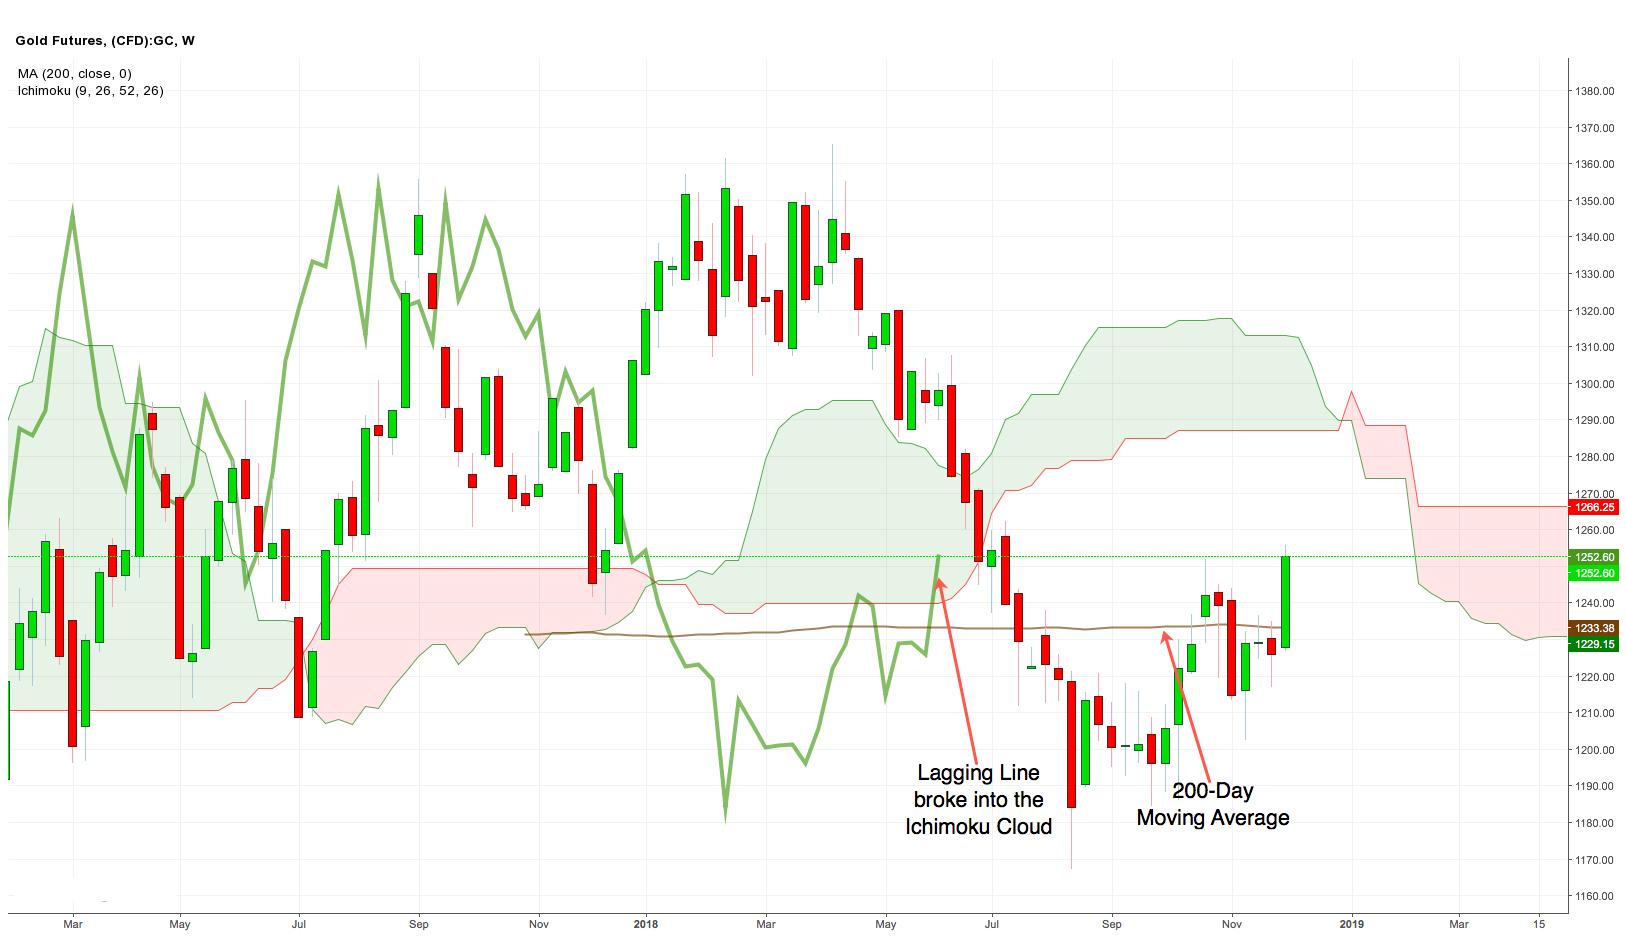 The commodity's weekly chart reinforces the fact that gold will be having a further bullish ascent due to the formation of a 'Bull Sash' pattern. This candle pattern psychology indicates to investors the bull's ability to keep the market moving up into the session. This in turn helps reinforce the fact that the bulls have gained the upper hand. Moreover, the current candle has broken above the 200-day moving average which provides us with a further bullish confirmation. Lastly, we see that the stocks lagging line has entered the Ichimoku Cloud. Thus, if it manages to break above the cloud then investors can expect an extremely strong bullish move. However, we will have to wait to see if that happens. Furthermore, I believe the Federal reserve meeting on December 18th and 19th will play a large role in deciding whether there will be a breakout above the Ichimoku Cloud.
The Big Picture:
In conclusion, I am leaning towards the bulls being in the drivers' seat until the $1,268.68-mark. This notion of mine is fuelled by the fact that the technicals and fundamentals support an ascent. However, whichever way you do decide to trade, do ensure that you utilize trailing stops, as this shall aid in capital preservation which is of prime importance.
Good luck trading.
Disclosure: I/we have no positions in any stocks mentioned, and no plans to initiate any positions within the next 72 hours.
I wrote this article myself, and it expresses my own opinions. I am not receiving compensation for it (other than from Seeking Alpha). I have no business relationship with any company whose stock is mentioned in this article.
Follow Sandeep Singh Ahluwalia and get email alerts