Yield Curve Inversion Supports Gold Bulls
Gap between 10-year yield and fed funds rate is good news for bullion.
This yield curve inversion reflects the widespread fear supporting gold.
Expect a corrective pause, then a continuation of gold's upward run.
Gold continues to mark time by consolidating its recent gains while waiting for its widely-watched 50-day moving average to "catch up" to the gold price. Gold stocks, too, are undergoing a consolidation as the recent run-up in prices resulted in an over-extended market and encouraged some profit taking. Yet despite the latest corrective pause, the major factors behind gold's surge in demand since last year are still in place. In today's report, we'll discuss the signs which point to gold' intermediate-term (3-6 month) upward trend continuing, including the spread of fear due to an inversion between U.S. Treasury yields and the Fed funds interest rate.
It's commonly understood that fear is one of gold's greatest allies. The preponderance of fear actively serves to increase yellow metal demand in times when uncertainty reigns supreme. Investors typically buy gold when they are afraid of either a.) the erosion of their savings via runaway inflation; or b.) the erosion of their savings via severe financial market volatility. In other words, gold's two biggest rally catalysts are the dual threats of runaway inflation or runaway deflation.
Right now investors are more concerned about the latter than the former. The widely-held fear that the global economy could deflate began last year when the tariff war between the U.S. and China kicked into high gear. Since then, investors are even more scared over the potentially negative impacts of an all-out trade war on the global economy than they were last year. The price of gold recently hitting a 6-year high testifies to investors' continued demand for safety.
The fact that U.S. Treasury bond yields are collapsing while the U.S. dollar index (DXY) is rising is further proof that the demand for safety assets is running high in the face of trade war concerns. As investors continue to actively seek out safety, the dollar's value has increased along with that of U.S. Treasuries and gold. It's unusual for all three assets to be rising in unison unless the smell of recession (or deflation) is high in the air.
Another factor which has increased gold demand is the rising concern over the inversion of several Treasury yield curves. Most recently, the 10-year vs. 2-year Treasury yield curve became inverted, which spooked many investors into selling stocks and buying gold and higher-yielding corporate and sovereign bonds.
One of the most important yield curves is the one which compares the U.S. 10-year Treasury note yield with the Fed funds interest rate. This is the yield curve which shows in vivid detail whether the Fed's monetary policy is tight or loose. As you can see in the following graph, the 10-year Treasury yield is conspicuously below the Fed funds rate. This suggests that Fed policy is too tight and, if it persists long enough, there's a very good chance it will eventually weaken the economy. This is the yield curve that, in my opinion, gold investors should be focusing on.
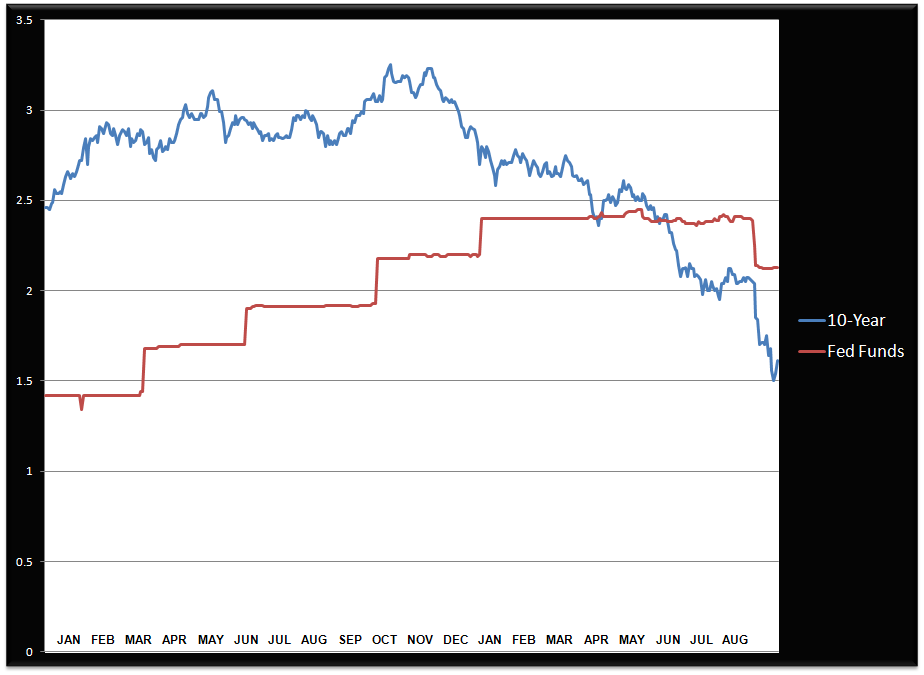
Source: St. Louis Fed
When the 10-year yield was decisively above the Fed funds rate through the first half of 2018, gold prices were still under selling pressure as there simply wasn't a safety bid for gold. But starting last October, it became clear to participants that the Fed was getting carried away with its rate-hiking campaign even as Treasury yields were starting to decline. This is when gold's fortunes began to noticeably improve, and the closer the Treasury/Fed funds yield curve came to inverting, the more heavily in demand gold became. The lesson here is that as long as the Fed funds rate is above the 10-year yield, investors aren't wrong to seek some protection against a possible global downturn by owning gold.
The gold price meanwhile has remained above its 15-day moving average with consistency on a weekly closing basis since May. Historically, it's very rare for gold or another actively traded commodity to remain above the 15-day MA for more than three months without at least a shallow decline and temporary move below this trend line. This means that investors should be aware that gold is becoming more vulnerable to a pullback. However, based on the high level of fear which pervades the market, investors should expect that a move below gold's 15-day trend line will be only temporary and likely not very deep. I'm also expecting gold will remain above its rising 50-day moving average (see chart below) throughout the duration of its next "correction."
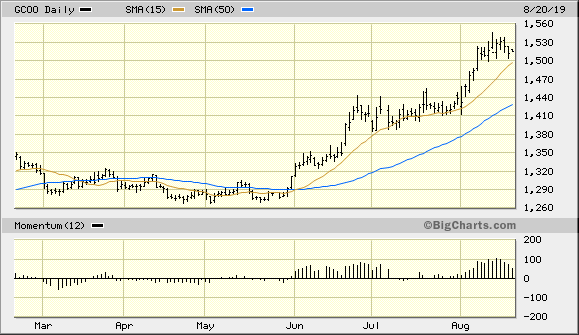
Source: BigCharts
It must be considered, however, that it's equally possible that gold's next correction phase could amount to nothing more than an extended sideways move with minimal volatility. This would also allow the 50-day moving average to "catch up" with the over-extended gold price. Regardless of which form gold's next corrective move takes, the fear which underlies the high demand for gold and gold mining shares should remain intact in the coming weeks.
Turning our attention to the mining stocks, the PHLX Gold/Silver Index (XAU) recently fell under its 15-day moving average. This corrective move was expected based on the slowdown in the 4-week rate of change (momentum) of the new highs and lows of the 50 most actively traded gold shares as discussed in previous reports. The XAU is also much closer in line with its 50-day moving average than the gold price is. This should help prepare the gold stocks for the next leg higher in what should be a productive rest of the year for mining stock investors.
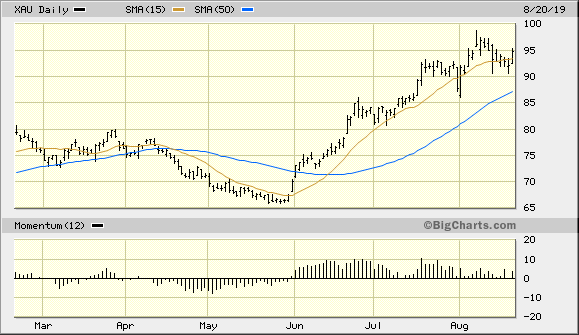
Source: BigCharts
However, until the 4-week momentum indicator of the new highs and lows for the gold stocks turns up again (below), I'm not recommending any new purchases among individual gold mining companies. While existing long positions in gold stocks and ETFs can be held for now, I suggest waiting for an improvement in the internal structure of the market before adding to those positions.
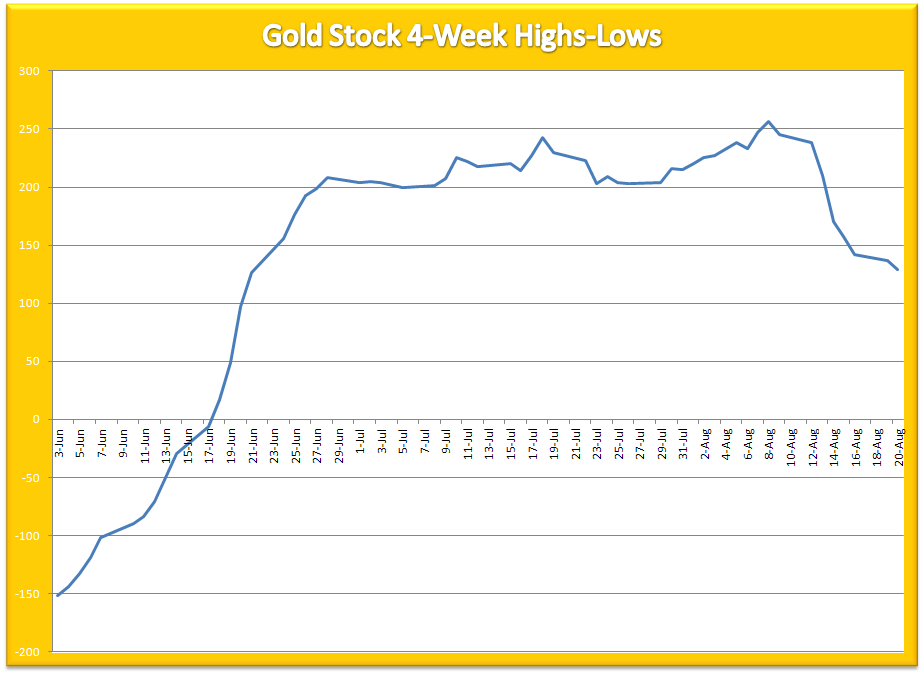
Source: NYSE
In summary, gold and the gold mining stocks are benefiting from the flight to safety among global investors and should continue to do so in the months ahead. The same fear and yield curve-related factors which have bolstered gold's performance since last fall haven't dissipated. As long as this fear continues, the precious metals market will have strong support and will continue to outperform other asset categories. Investors are therefore justified in maintaining intermediate-to-longer-term investment positions in gold and gold ETFs, as well as gold mining stocks.
On a strategic note, I'm currently long gold via the VanEck Vectors Gold Miners ETF (GDX). For this ETF I'm using a level slightly under $27.00 as a stop-loss on an intraday basis. Participants who haven't done so should also book some profit in GDX after its impressive run of the last few weeks.
Disclosure: I am/we are long GDX. I wrote this article myself, and it expresses my own opinions. I am not receiving compensation for it (other than from Seeking Alpha). I have no business relationship with any company whose stock is mentioned in this article.
Follow Clif Droke and get email alerts